Fig. C.3
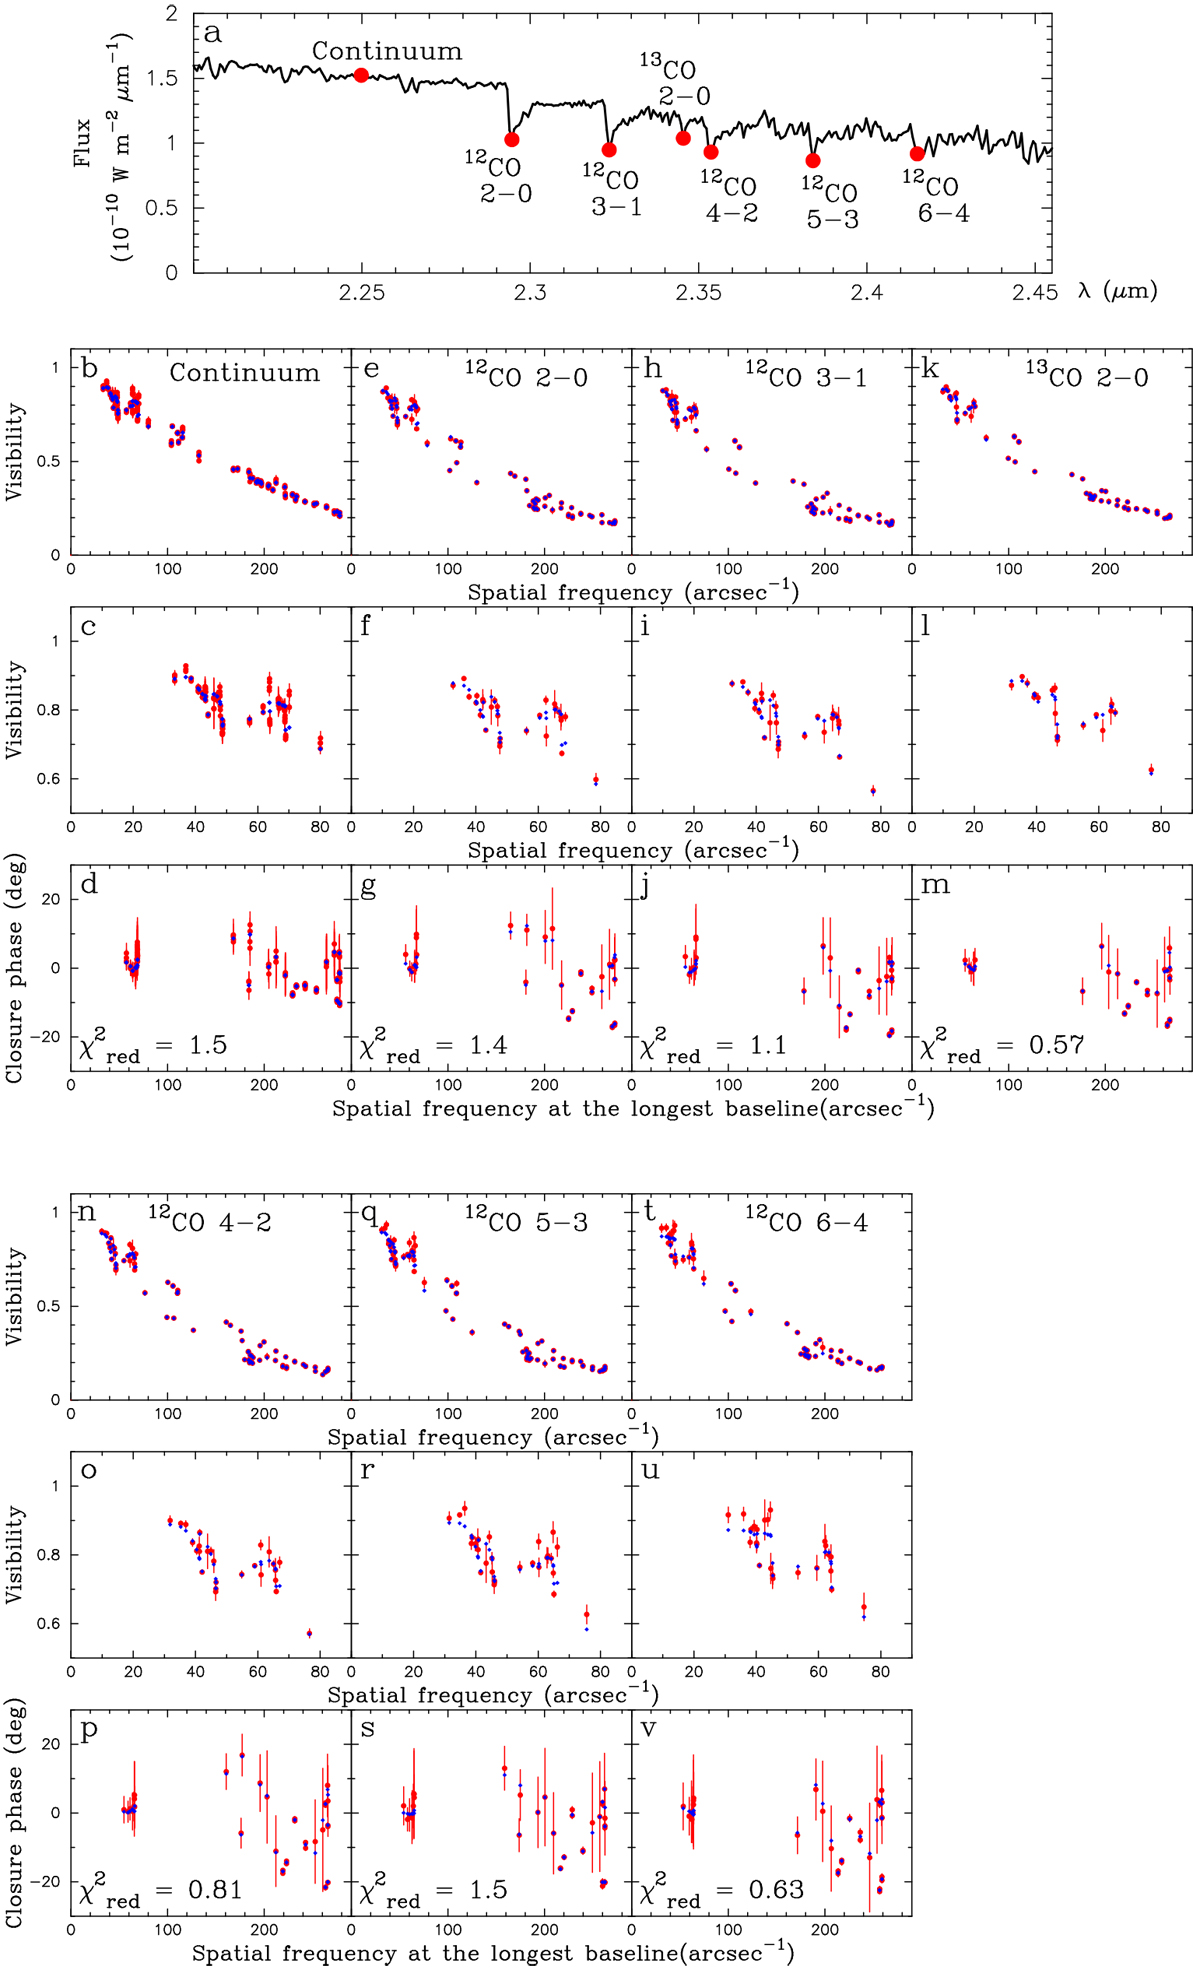
Comparison of the observed interferometric observables with those computed from the (unconvolved) images of HR3126 reconstructed with the pixel difference quadratic regularization. (a) Observed spectrum of HR3126. The filled dots represent the wavelength channels at which the comparison of the interferometric observables is shown in the panels below. (b–m) Columns each show the comparison of the visibility, visibility at low spatial frequencies, and closure phase in the continuum and three CO band heads (12CO 2–1, 3–1, and 13CO 2–0). The measurements and the values computed from the reconstructed images are plotted with the red symbols with the error bars and the blue symbols, respectively. The total reduced χ2 value of the fit (including both the visibility and closure phase) is also shown in each column. (n–v) Comparison in the 12CO 4–2, 5–3, and 6–4 band heads shown in the same manner as in panels b–m.
Current usage metrics show cumulative count of Article Views (full-text article views including HTML views, PDF and ePub downloads, according to the available data) and Abstracts Views on Vision4Press platform.
Data correspond to usage on the plateform after 2015. The current usage metrics is available 48-96 hours after online publication and is updated daily on week days.
Initial download of the metrics may take a while.