Fig. 8
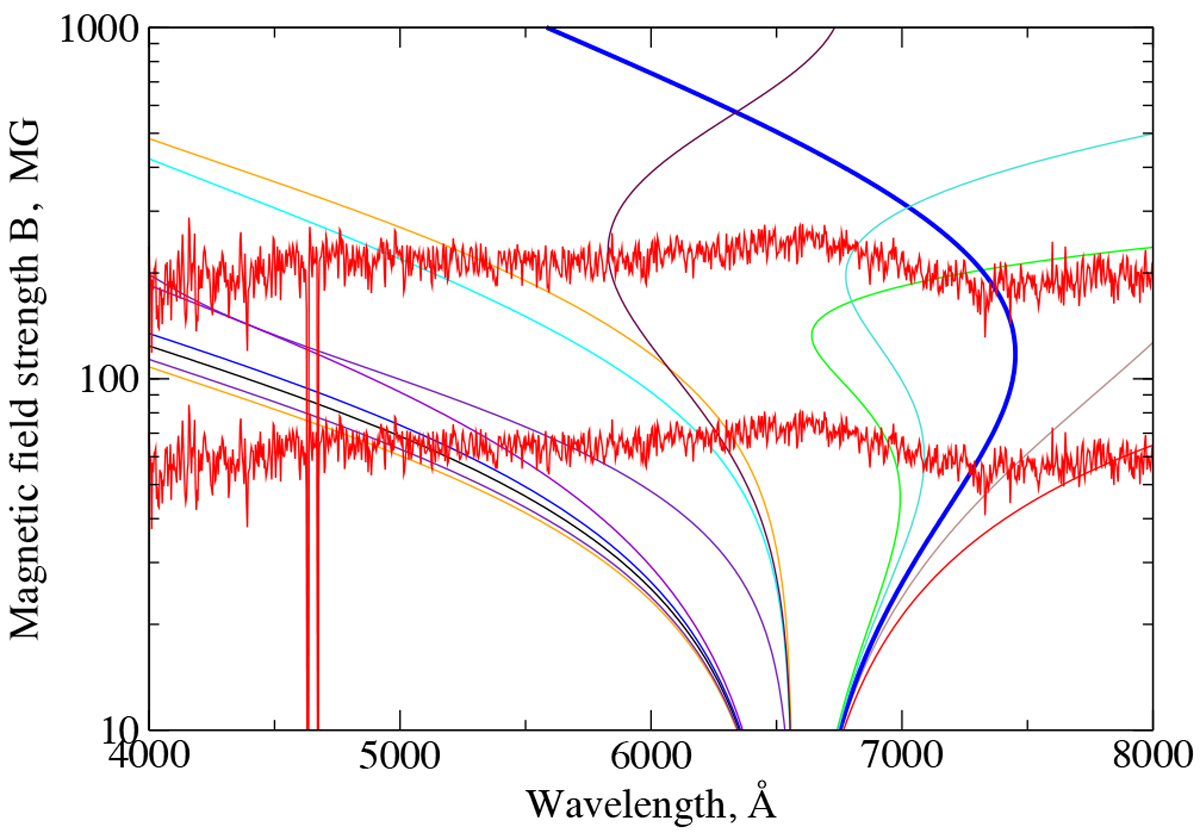
WD 0004+122: V∕I spectrum of WD 0004+122 (red) superposed twice on diagram showing wavelengths of Hα components as a function of field strength. Spectra are placed at approximate levels where 7330 Å polarisation feature coincides with strongest red σ transition 2p-1–3d-2 (heavy blue curve), showing possible interpretation of feature as produced by either ⟨|B|⟩ ≈60 or ⟨|B|⟩≈ 200 MG field.).
Current usage metrics show cumulative count of Article Views (full-text article views including HTML views, PDF and ePub downloads, according to the available data) and Abstracts Views on Vision4Press platform.
Data correspond to usage on the plateform after 2015. The current usage metrics is available 48-96 hours after online publication and is updated daily on week days.
Initial download of the metrics may take a while.