Free Access
Fig. 5
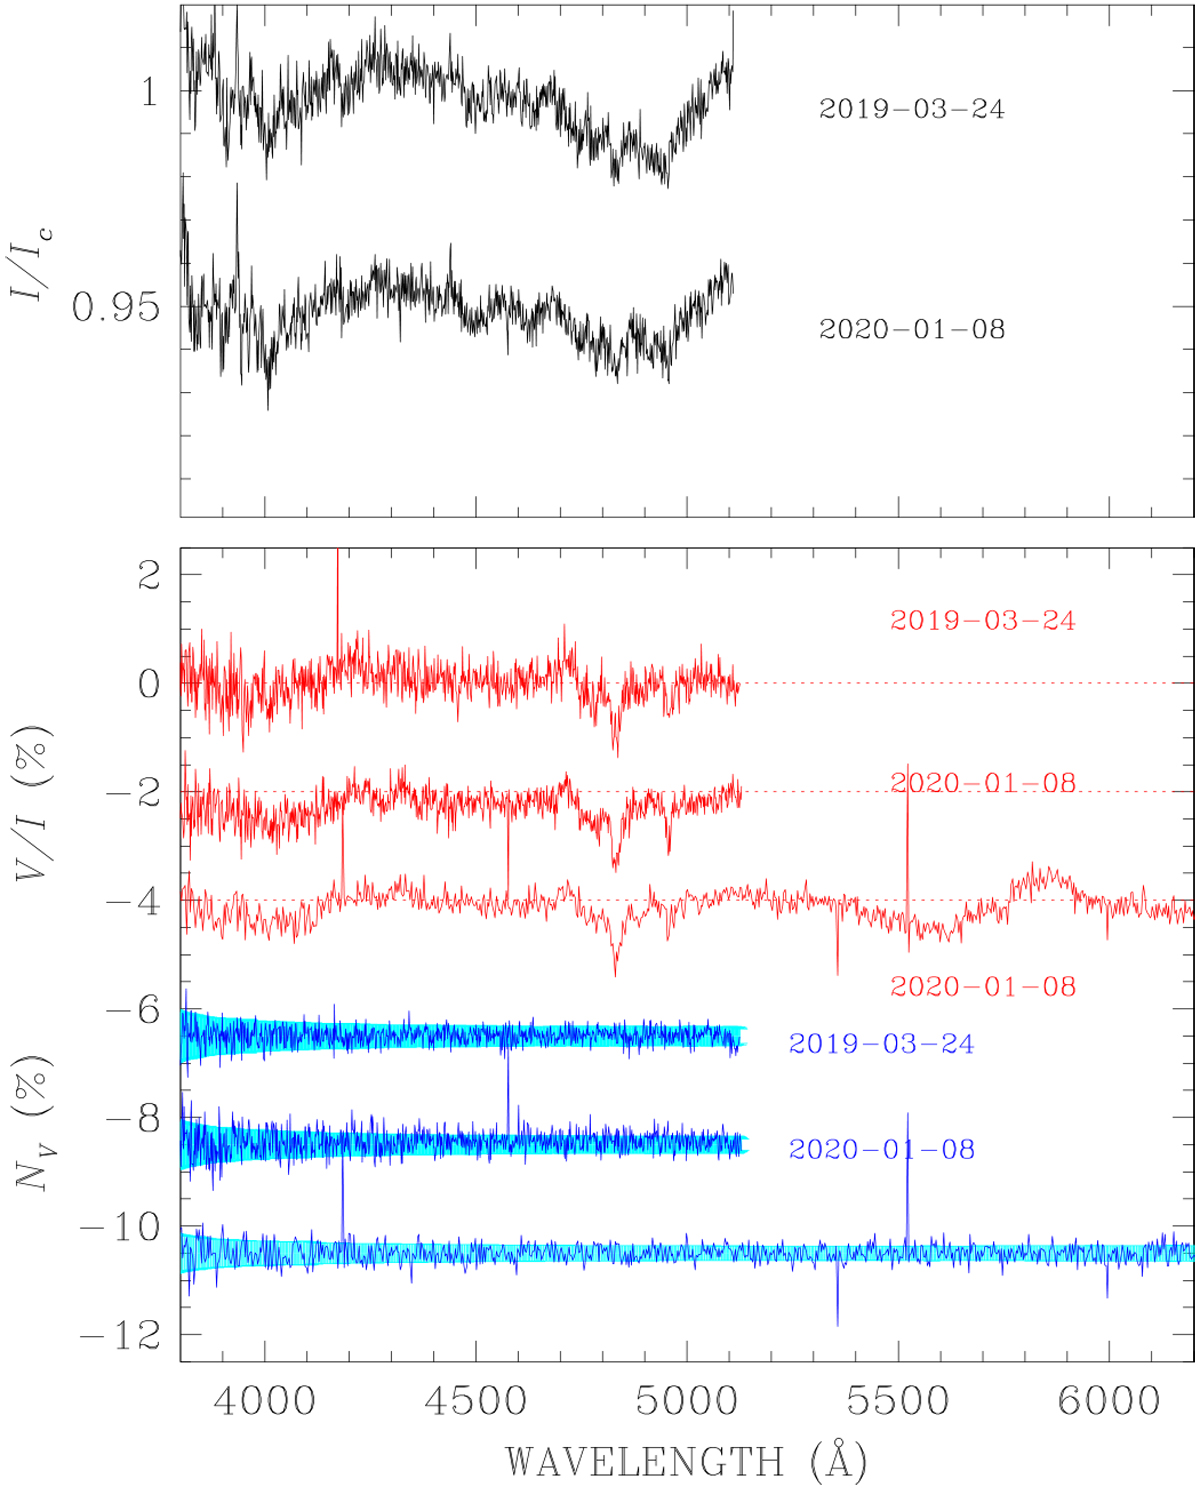
WD 0810−353: observed flux normalised to the continuum as explained in the text (top panel, black solid lines with error bars); V∕I (bottom panel, red solid lines) and null profiles NV (bottom panel, blue solid line), offset for display purpose, and superposed to the V∕I error bars (in light blue).
Current usage metrics show cumulative count of Article Views (full-text article views including HTML views, PDF and ePub downloads, according to the available data) and Abstracts Views on Vision4Press platform.
Data correspond to usage on the plateform after 2015. The current usage metrics is available 48-96 hours after online publication and is updated daily on week days.
Initial download of the metrics may take a while.