This article has 2 errata:
[https://doi.org/10.1051/tpe/2021006]
[https://doi.org/10.1051/0004-6361/202038534e]
Fig. 8
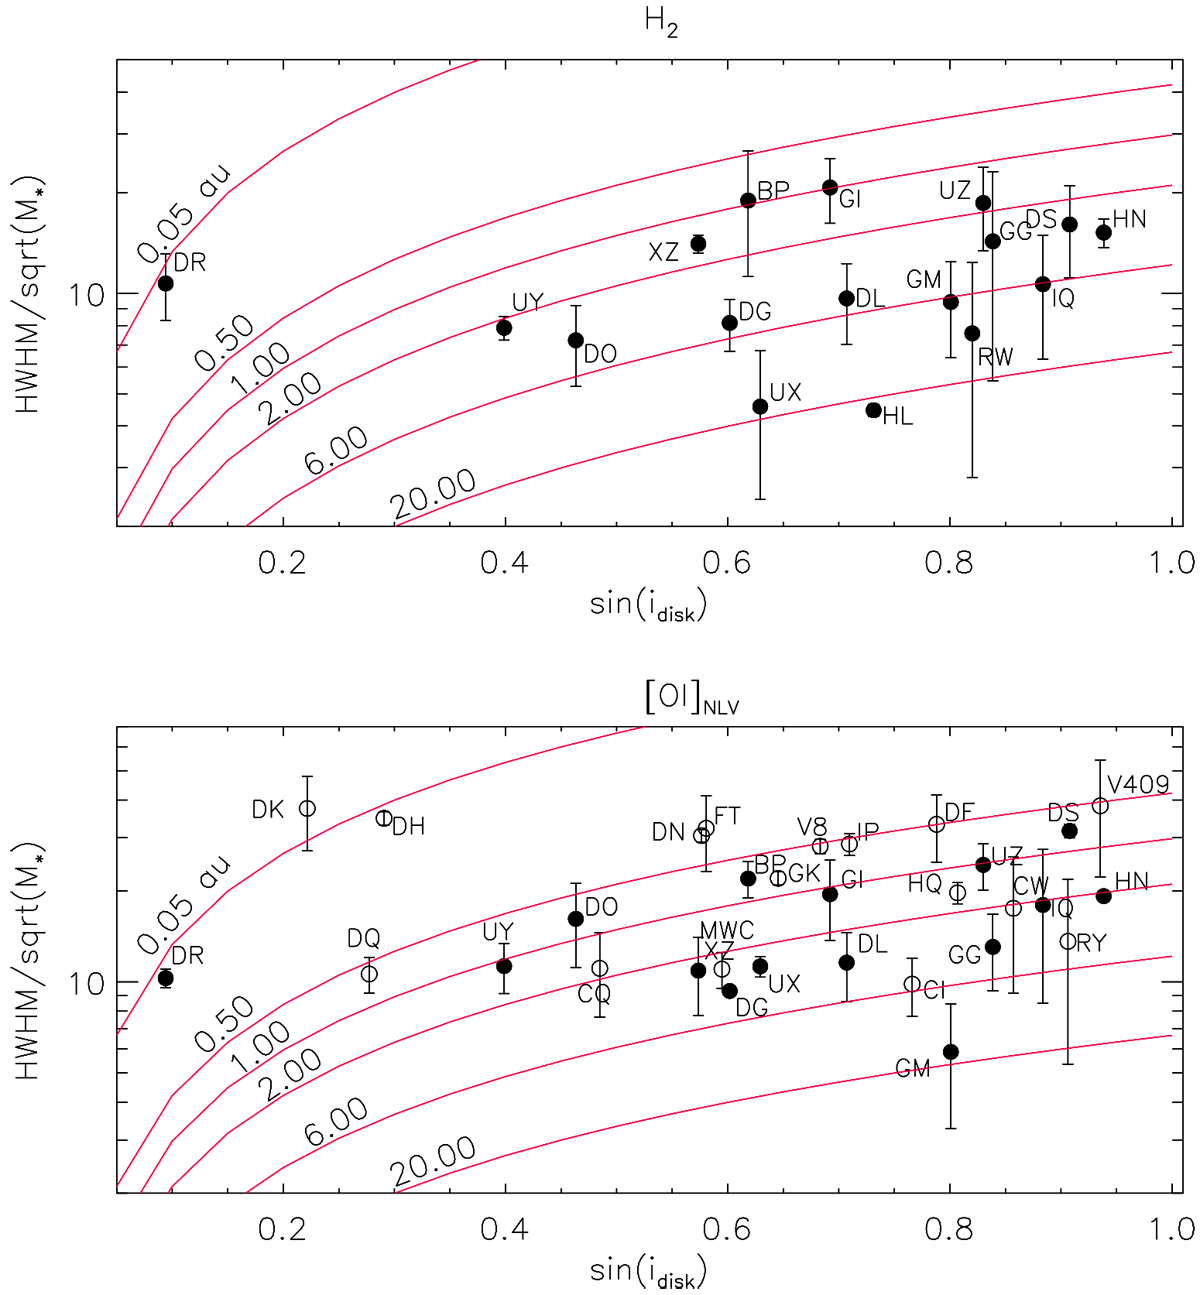
Half-width at half maximum divided by the square root of the stellar mass for the H2 (top) and [O I] (bottom) NLVC as a function of the sine of the disk inclination. Keplerian models for gas emitted from disk radii of 0.05, 0.50, 1.00, 2.00, 6.00, and 20.00 au are shown as solid red lines. Bottom panel: empty circles refer to stars whose H2 profile is not detected.
Current usage metrics show cumulative count of Article Views (full-text article views including HTML views, PDF and ePub downloads, according to the available data) and Abstracts Views on Vision4Press platform.
Data correspond to usage on the plateform after 2015. The current usage metrics is available 48-96 hours after online publication and is updated daily on week days.
Initial download of the metrics may take a while.