Free Access
This article has 2 errata:
[https://doi.org/10.1051/tpe/2021006]
[https://doi.org/10.1051/0004-6361/202038534e]
Fig. A.1
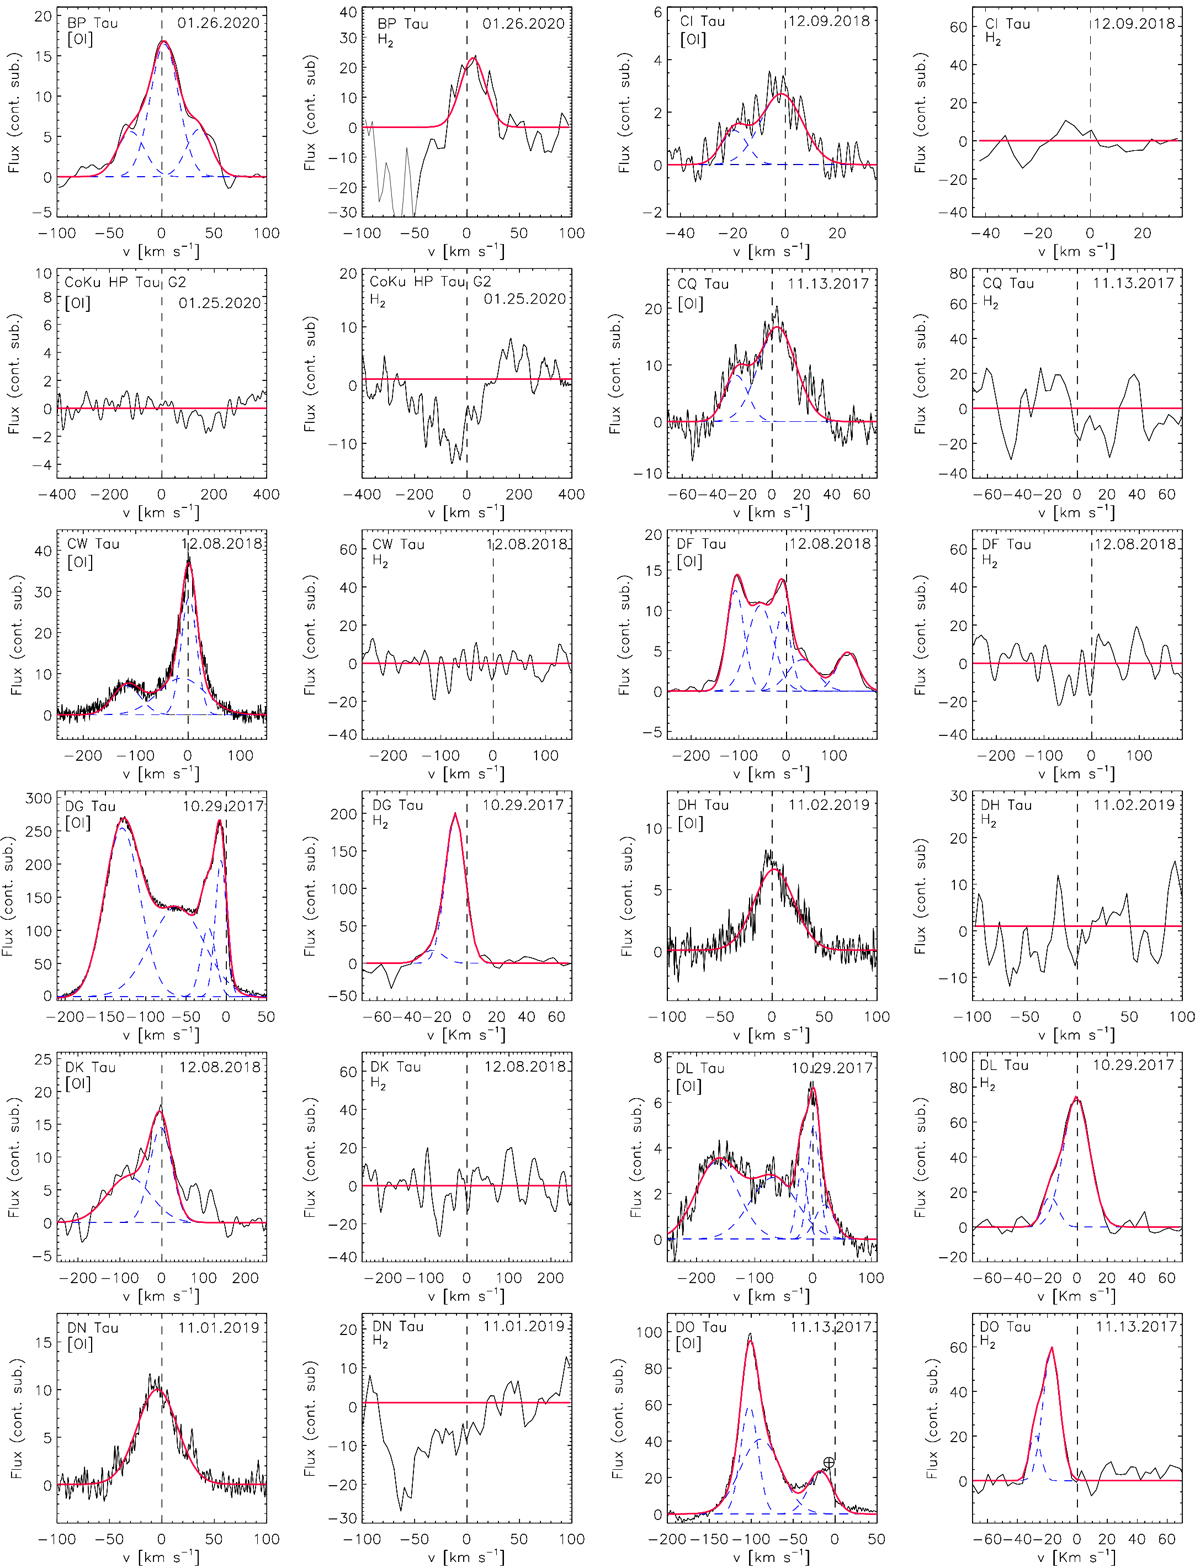
Continuum-subtracted [O I] and H2 line profiles. In red we plot the fit to the profile, obtained by adding single or multiple Gaussians (dashed blue lines). Flux units are 10−15 erg s−1 cm−2 Å−1. For each panel, we indicate the target name and date of observation (MM.DD.YYYY).
Current usage metrics show cumulative count of Article Views (full-text article views including HTML views, PDF and ePub downloads, according to the available data) and Abstracts Views on Vision4Press platform.
Data correspond to usage on the plateform after 2015. The current usage metrics is available 48-96 hours after online publication and is updated daily on week days.
Initial download of the metrics may take a while.