Fig. 3

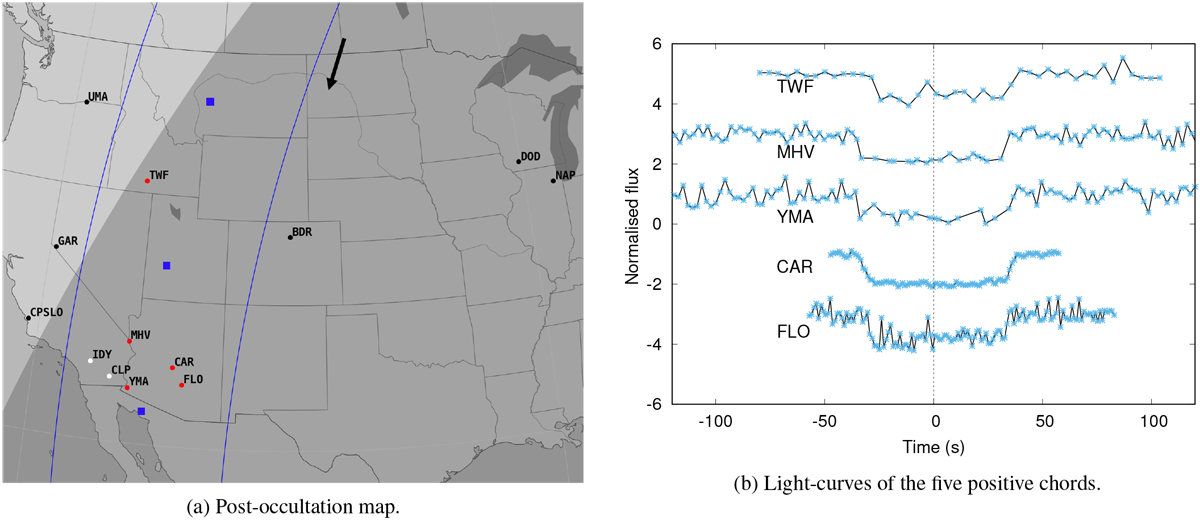
Panel a: post-occultation map for the stellar occultation by Varda on September 10, 2018. Blue lines represent the projected equivalent diameter of the object, and blue squares represent the position of the body centre (every minute); the northernmost dot corresponds to 03:33:02.934 UTC. The direction of the shadow is shown by the black arrow at the top centre of the panel. The red and black pins on the map represent the sites that reported +ve and –ve observations, whereas the white pins show the (NDR – no data recorded) stations that experienced technical problems that prevented them from recording the occultation (cf. Table 3). Panel b: five occultations detected at the TWF, MHV, YMA, CAR, and FLO stations (from the westernmost to the easternmost on the sky plane, cf. Fig. 6). Each light-curve has been normalised between 0 (Varda flux) and 1 (fluxes of the unocculted star and of Varda). For the sake of legibility, each light-curve has been centred at mid-chord time for each chord, and a manual offset in flux has been applied. The associated data to the normalised, non-centred light-curves are available at the CDS.
Current usage metrics show cumulative count of Article Views (full-text article views including HTML views, PDF and ePub downloads, according to the available data) and Abstracts Views on Vision4Press platform.
Data correspond to usage on the plateform after 2015. The current usage metrics is available 48-96 hours after online publication and is updated daily on week days.
Initial download of the metrics may take a while.


