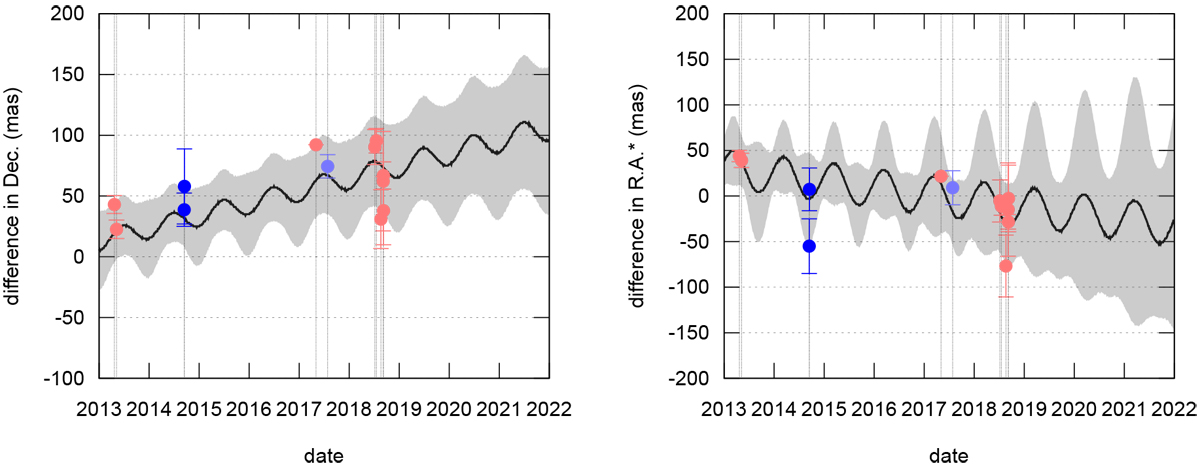
Fig. 1

Difference between NIMAv6 and JPL7 in Dec (declination, left) and RA* (right ascension weighted by cosδ, right) over the time interval 2013–2022. Each dot represents the mean residual and the standard deviation of one night of observations. Dark blue points indicate data reduced with the Wide Field Imager catalogue (see text), light blue points show data reduced with Gaia-DR1, and light red points show data reduced with Gaia-DR2. The continuous black line represents the best-fitting curve to these data, whereas the grey shaded area represents the 1σ uncertainty of the NIMAv6 ephemeris (https://lesia.obspm.fr/lucky-star/obj.php?p=46).
Current usage metrics show cumulative count of Article Views (full-text article views including HTML views, PDF and ePub downloads, according to the available data) and Abstracts Views on Vision4Press platform.
Data correspond to usage on the plateform after 2015. The current usage metrics is available 48-96 hours after online publication and is updated daily on week days.
Initial download of the metrics may take a while.


