Fig. B.1.
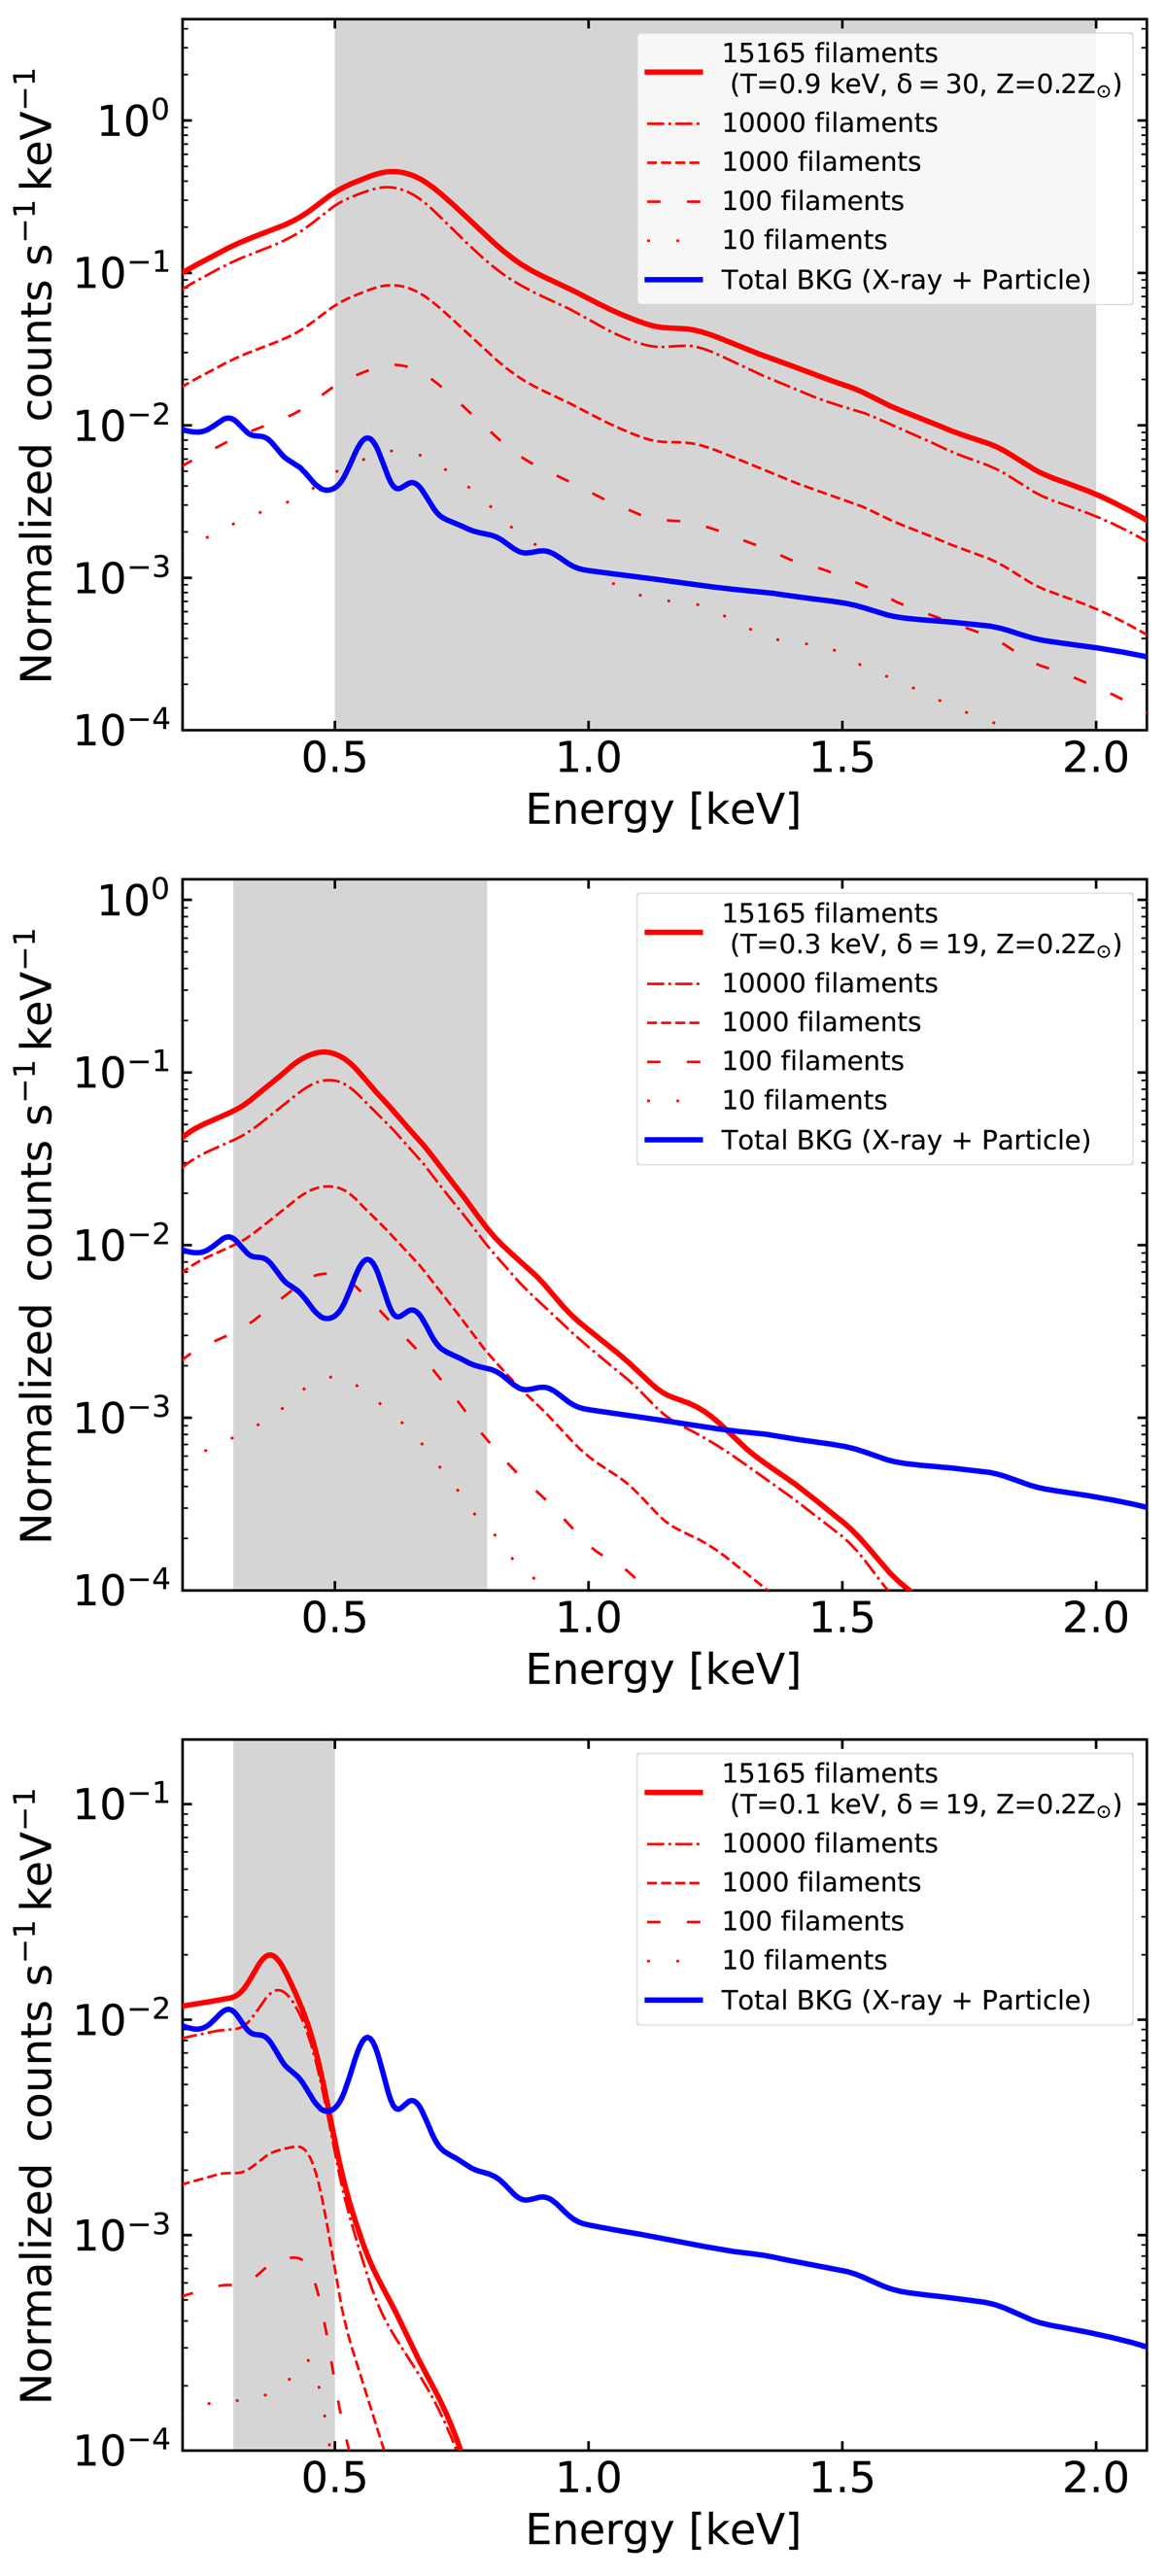
Simulated energy spectra for SRG/eROSITA from the gas at the cores of filaments. Top panel: the spectra are calculated with an overdensity of 30, a temperature of 0.9 keV, and a metallicity of 0.2 Z⊙. The stacked spectra (red curves) display the expected signal from the brightest N filaments (with N = 10 to 15 165). Energy spectra are also simulated assuming overdensity of 19, temperature of 0.3 keV and metallicity of 0.2 Z⊙ in the middle panel, and overdensity of 19, temperature of 0.1 keV and metallicity of 0.2 Z⊙ in the bottom panel. Blue: simulated background energy spectrum of SRG/eROSITA. The optimal energy ranges to maximize the S/N for 15 165 filaments are shown as a light gray area.
Current usage metrics show cumulative count of Article Views (full-text article views including HTML views, PDF and ePub downloads, according to the available data) and Abstracts Views on Vision4Press platform.
Data correspond to usage on the plateform after 2015. The current usage metrics is available 48-96 hours after online publication and is updated daily on week days.
Initial download of the metrics may take a while.