Fig. 3.
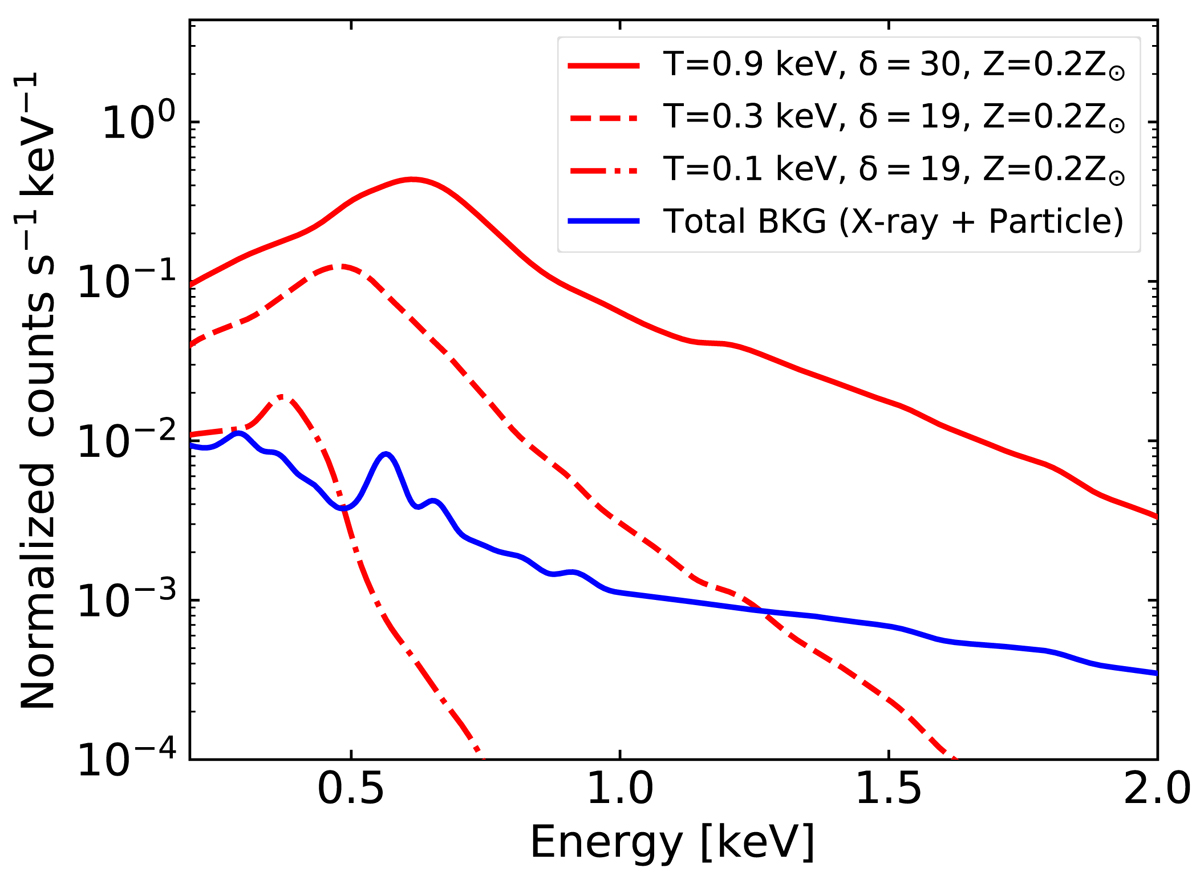
Red: simulated stacked energy spectrum of SRG/eROSITA from the gas at the cores of the stacked 15 165 filaments. The stacked spectrum is calculated with overdensity = 30, temperature = 0.9 keV, and metallicity = 0.2 Z⊙ and represented as a red solid curve. The stacked spectrum is also calculated assuming overdensity = 19, temperature = 0.3 keV and metallicity = 0.2 Z⊙ and shown as a red dashed curve, and overdensity = 19, temperature = 0.1 keV and metallicity = 0.2 Z⊙ and shown as a dash-dotted curve. Blue: simulated background energy spectrum of SRG/eROSITA based on the model from Merloni et al. (2012).
Current usage metrics show cumulative count of Article Views (full-text article views including HTML views, PDF and ePub downloads, according to the available data) and Abstracts Views on Vision4Press platform.
Data correspond to usage on the plateform after 2015. The current usage metrics is available 48-96 hours after online publication and is updated daily on week days.
Initial download of the metrics may take a while.