Fig. 2.
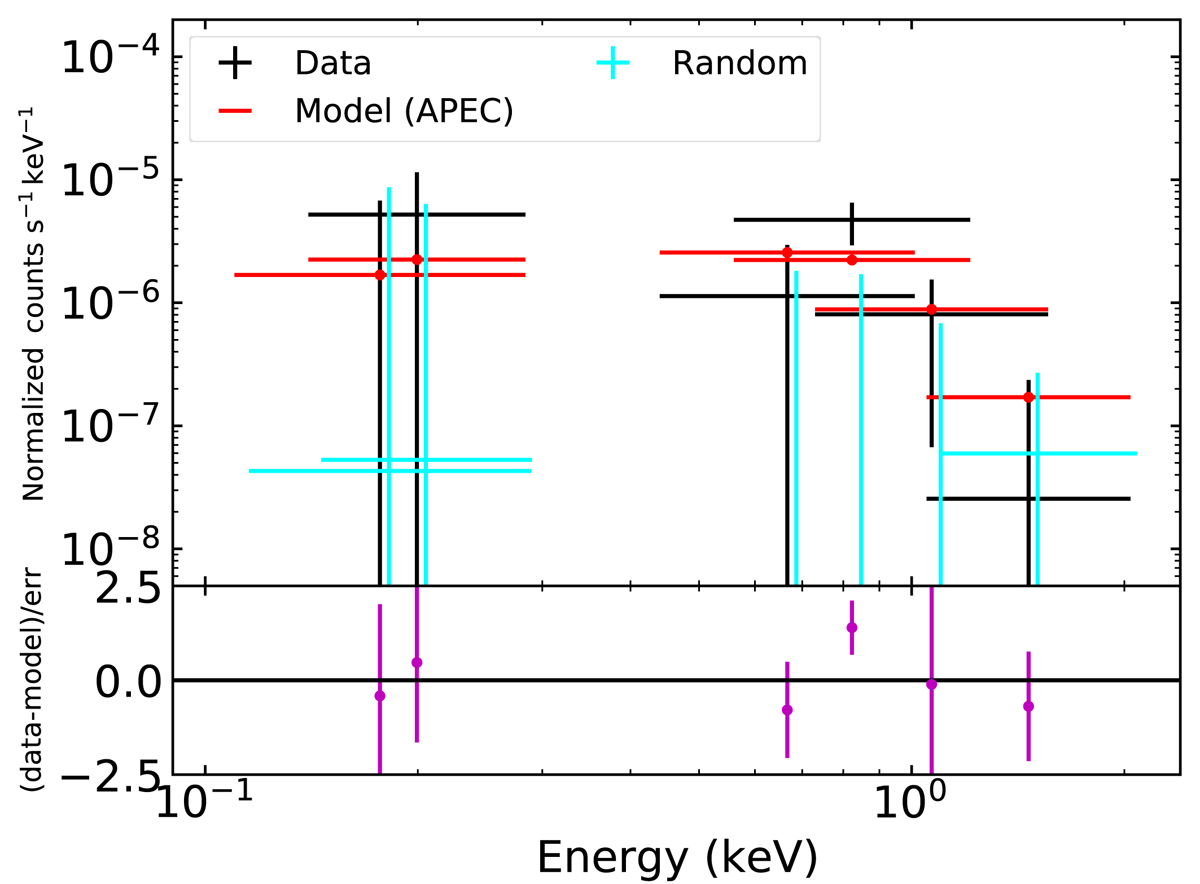
Top panel: black: excesses of X-ray emission at the cores of 15 165 filaments (<2 Mpc from the filament spines), relative to the background (average X-ray signal at 10−20 Mpc from the filament spines), in the six ROSAT energy bands (R1, R2, R4, R5, R6, and R7). The 1σ uncertainties are estimated by a bootstrap resampling. Cyan: X-ray emission at the cores from 1000 random sampling. The 1σ uncertainties are estimated by computing a standard deviation of 1000 random sample. The data points from the random sampling shift slightly to the right on the X-axis for a visualization. Red: X-ray fit to the data with the APEC model (see text for details). Bottom panel: magenta: ratio of data and model at each energy band.
Current usage metrics show cumulative count of Article Views (full-text article views including HTML views, PDF and ePub downloads, according to the available data) and Abstracts Views on Vision4Press platform.
Data correspond to usage on the plateform after 2015. The current usage metrics is available 48-96 hours after online publication and is updated daily on week days.
Initial download of the metrics may take a while.