Fig. 6
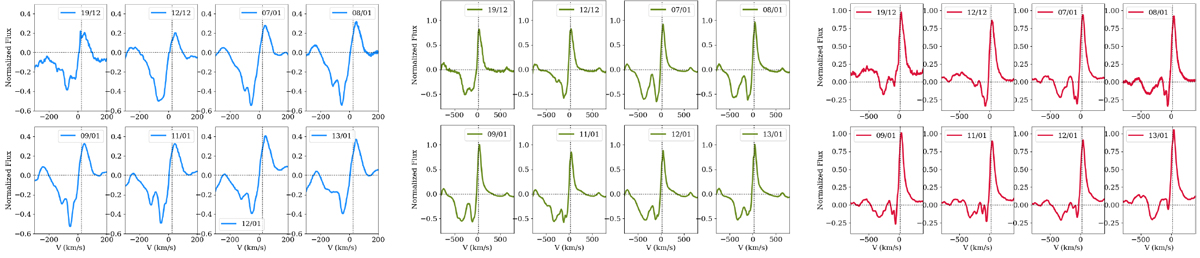
Examples of the time variability observed for the Ti II 4468 Å line (left, blue), the Fe II 4923 Å line (middle, green), and the Fe II 5316 Å line (right, red). In each case, the 8 subfigures display the individual spectra as they were obtained in time. The dotted lines indicate the continuum level and the radial velocity of the source.
Current usage metrics show cumulative count of Article Views (full-text article views including HTML views, PDF and ePub downloads, according to the available data) and Abstracts Views on Vision4Press platform.
Data correspond to usage on the plateform after 2015. The current usage metrics is available 48-96 hours after online publication and is updated daily on week days.
Initial download of the metrics may take a while.