Fig. 3
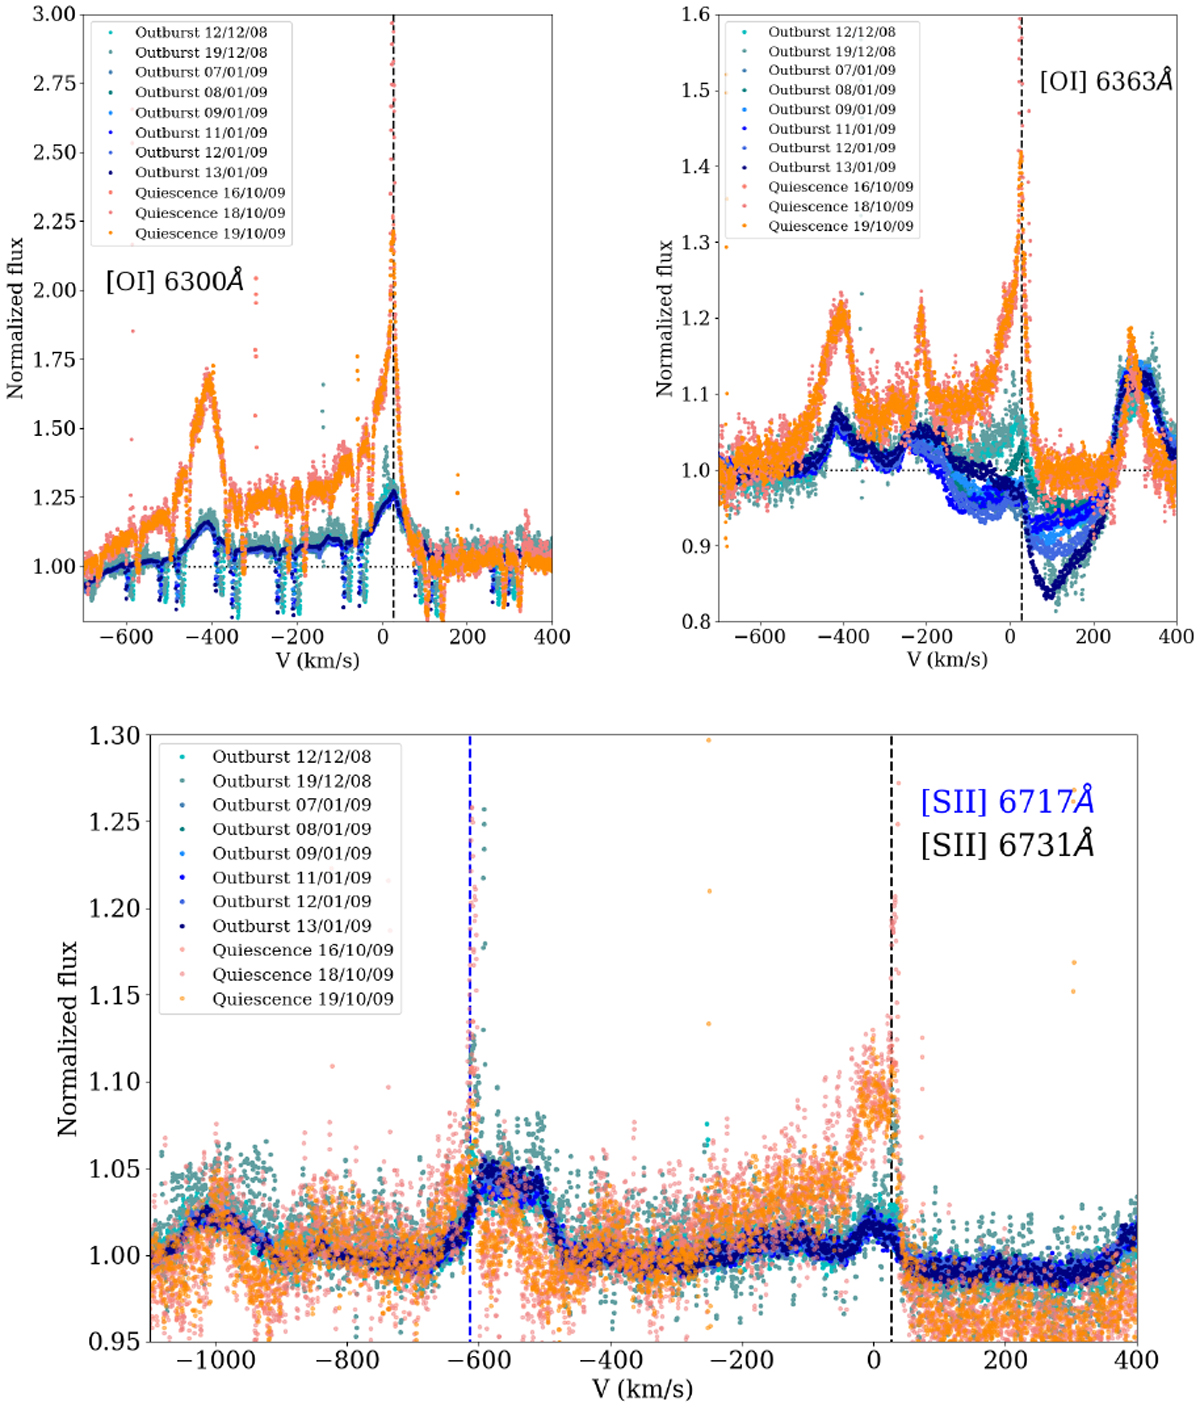
Upper: forbidden [O I] emission. Lower: forbidden [S II] emission. The dotted lines indicate the continuum level, and the dashed lines represent the radial velocity of 27 km s−1. The data from the outburst are plotted in various shades of blue, while the quiescence data are shown in orange. The extra lines observed in the 6363 Å spectrum correspond to unrelated Fe I and Fe II lines, and the strong absorption is due to Fe II 6369 Å. The narrow absorption lines are telluric.
Current usage metrics show cumulative count of Article Views (full-text article views including HTML views, PDF and ePub downloads, according to the available data) and Abstracts Views on Vision4Press platform.
Data correspond to usage on the plateform after 2015. The current usage metrics is available 48-96 hours after online publication and is updated daily on week days.
Initial download of the metrics may take a while.