Fig. C.4
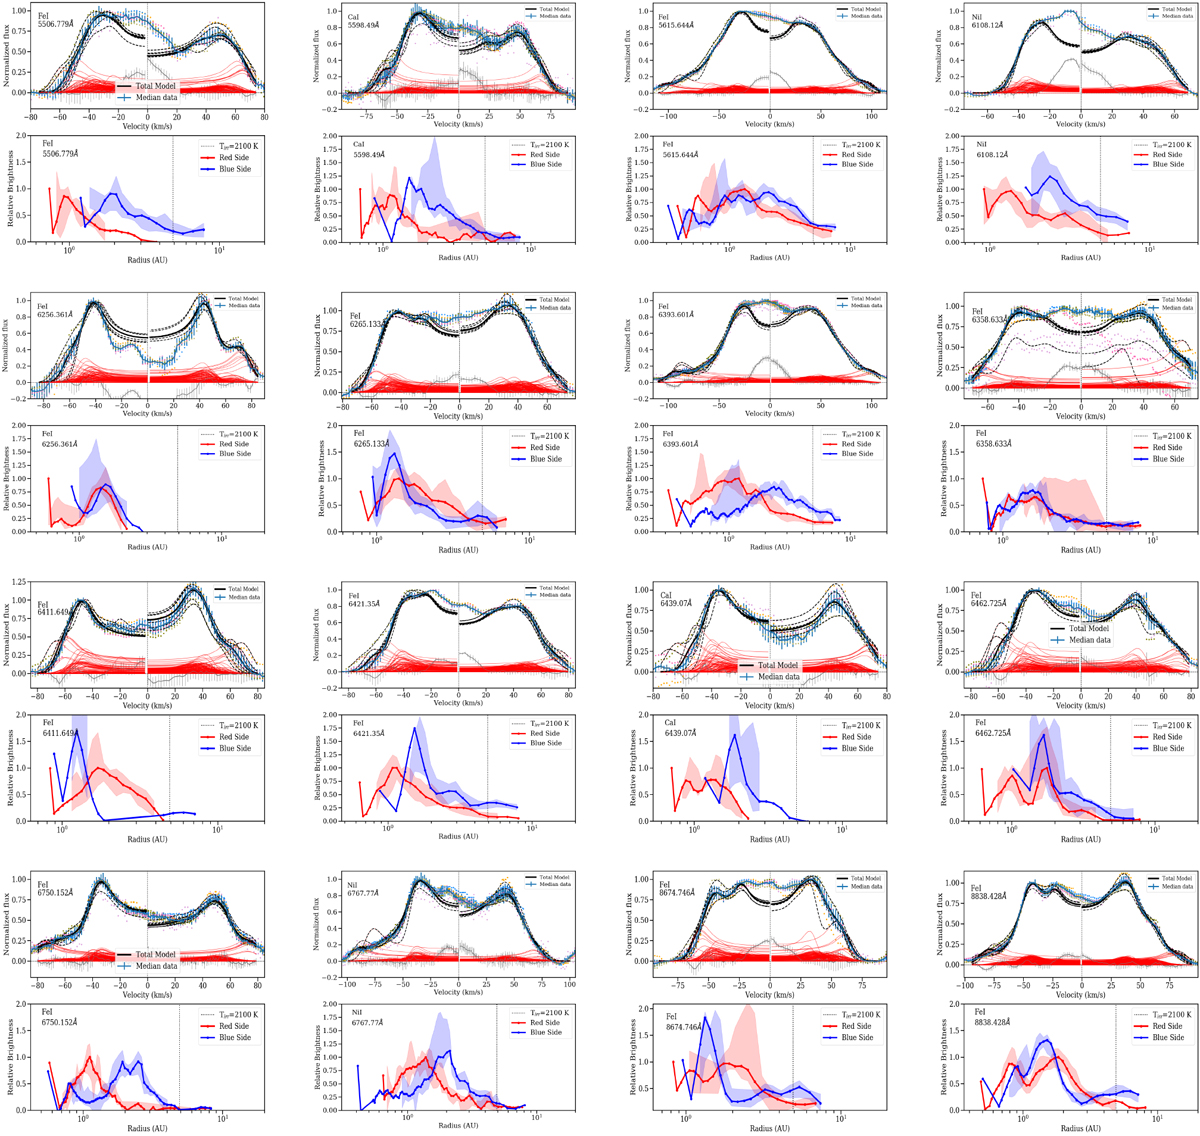
Brightness profile decomposition for the disk-like lines not shown in the main text (Fig. 13, continued). For each line, upper panel: normalized, median line emission (blue), individual data points (colored dots), and model fit. The black solid line represents the best fit to the median data, while the dashed lines indicate the fits to the individual datasets that are used to compute the errors. The zero velocity (measured with respect to the symmetry axis of the line) is shown as a dotted line. The individual ring fits are shown by thin red lines, and the residuals are shown in gray. Since we impose a limit of 35 au to avoid fitting potential narrow emission within the line, the center of the line is not well fitted. Lower panel for each line, the red and blue thick lines show the best fit to the median spectrum for the red and blue sides, while the shaded areas show the range spanned by the fits to the individual spectra. Because the noise in the single spectra is higher than in the median spectrum, there are no significant results at extreme velocities for some of the individual datasets. The vertical dotted line indicates the place where direct irradiation results in a temperature of 2100 K, which is independent of the model assumptions and stellar mass. All models are calculated for an inclination of 30 degrees and a stellar mass of 16 M⊙. A different inclination i would change the derived radii by sin2i/sin2(30), and a different stellar mass M* would change the derived radii by a factor of M*/16 M⊙, but the relative brightnesses would remain the same.
Current usage metrics show cumulative count of Article Views (full-text article views including HTML views, PDF and ePub downloads, according to the available data) and Abstracts Views on Vision4Press platform.
Data correspond to usage on the plateform after 2015. The current usage metrics is available 48-96 hours after online publication and is updated daily on week days.
Initial download of the metrics may take a while.