Fig. 2
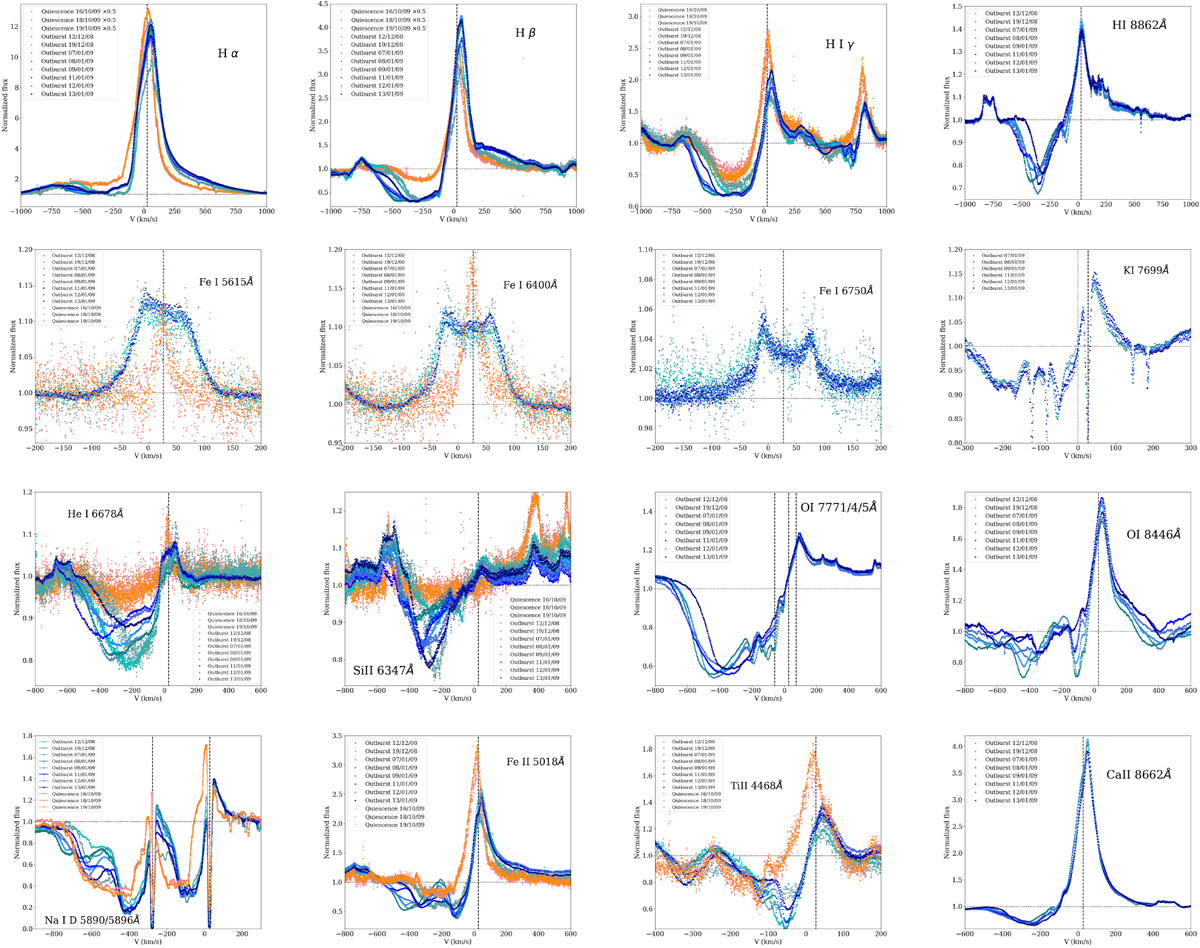
Examples of lines observed for Z CMa. The lines are normalized to the local continuum. In this and the following figures, the quiescence data are plotted in various shades of orange, while the outburst spectra are shown in blue. The dashed line shows the radial velocity of the system (27 km s−1) and the dotted line indicates the continuum level. First row: some H Balmer lines and an IR H line. The quiescence spectra of Hα and Hβ are scaled by × 0.5 for better display. Second row: some of the Fe I lines with disk-like profiles and a K I resonance line. Third and fourth rows: some lines with various types of P Cygni profiles. The quiescence spectra do not cover the range beyond 6940 Å.
Current usage metrics show cumulative count of Article Views (full-text article views including HTML views, PDF and ePub downloads, according to the available data) and Abstracts Views on Vision4Press platform.
Data correspond to usage on the plateform after 2015. The current usage metrics is available 48-96 hours after online publication and is updated daily on week days.
Initial download of the metrics may take a while.