Fig. C.1
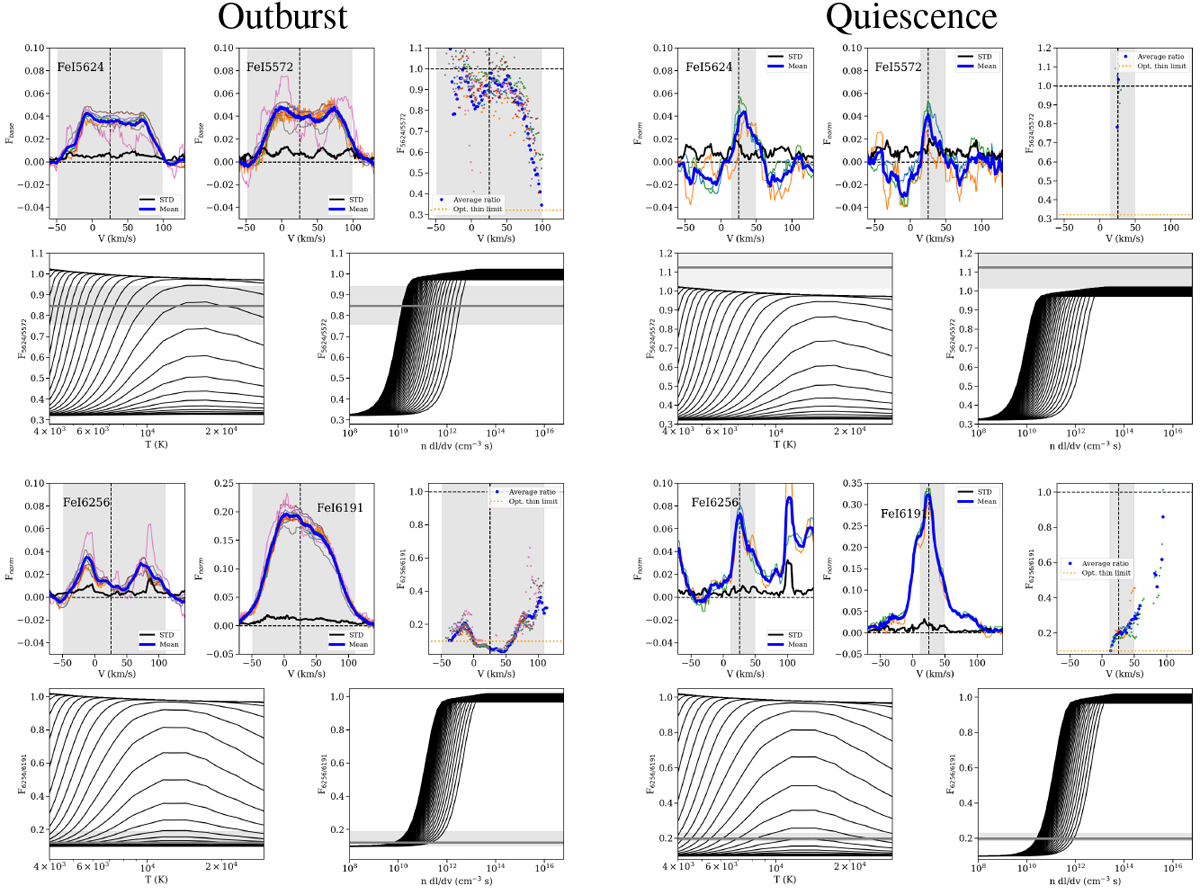
Analysis of the line ratio for Fe I transitions with upper common levels (Fig. 9, continued). Upper left panels: line emission in outburst; upper right panels: quiescence data. The ratios observed are compared to the theoretical calculations for a range of temperatures and column density-velocity gradients in the lower panels. The gray area shows the region for which the line emission is >5σ (in the velocity panels), and the 1σ error in the temperature and density planes.
Current usage metrics show cumulative count of Article Views (full-text article views including HTML views, PDF and ePub downloads, according to the available data) and Abstracts Views on Vision4Press platform.
Data correspond to usage on the plateform after 2015. The current usage metrics is available 48-96 hours after online publication and is updated daily on week days.
Initial download of the metrics may take a while.