Fig. A.1
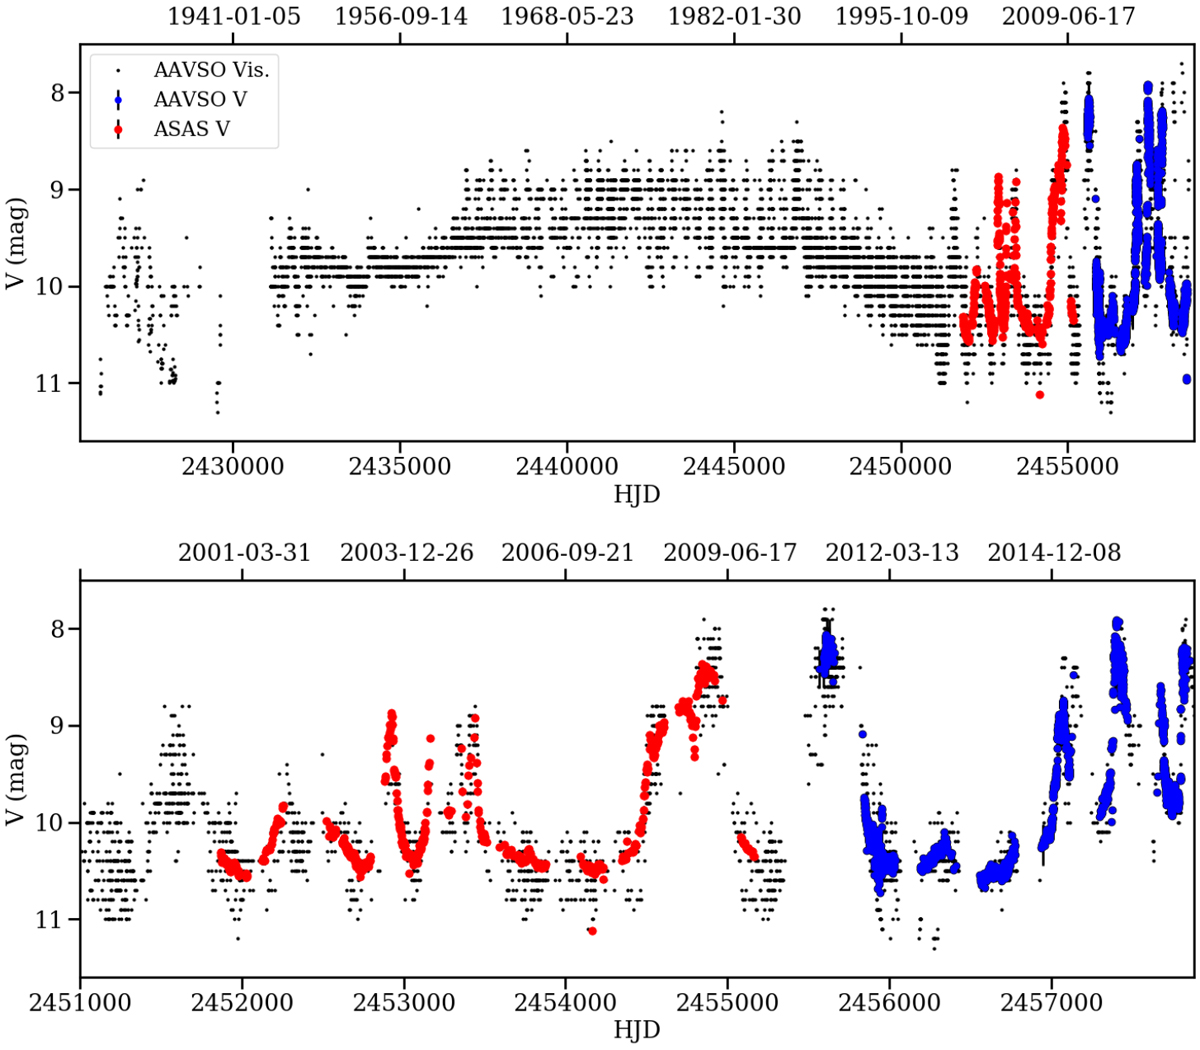
Light curves from AAVSO for Z CMa since 1930s (upper) and from 1999 to 2018 (lower). Only verified observations are included. The visual and V filters are plotted together, since they are similar for the current purpose of examining the timescales of the outbursts. As a comparison, the ASAS V filter is also plotted (red), which is in excellent agreement with the amateur V data.
Current usage metrics show cumulative count of Article Views (full-text article views including HTML views, PDF and ePub downloads, according to the available data) and Abstracts Views on Vision4Press platform.
Data correspond to usage on the plateform after 2015. The current usage metrics is available 48-96 hours after online publication and is updated daily on week days.
Initial download of the metrics may take a while.