Fig. B.1.
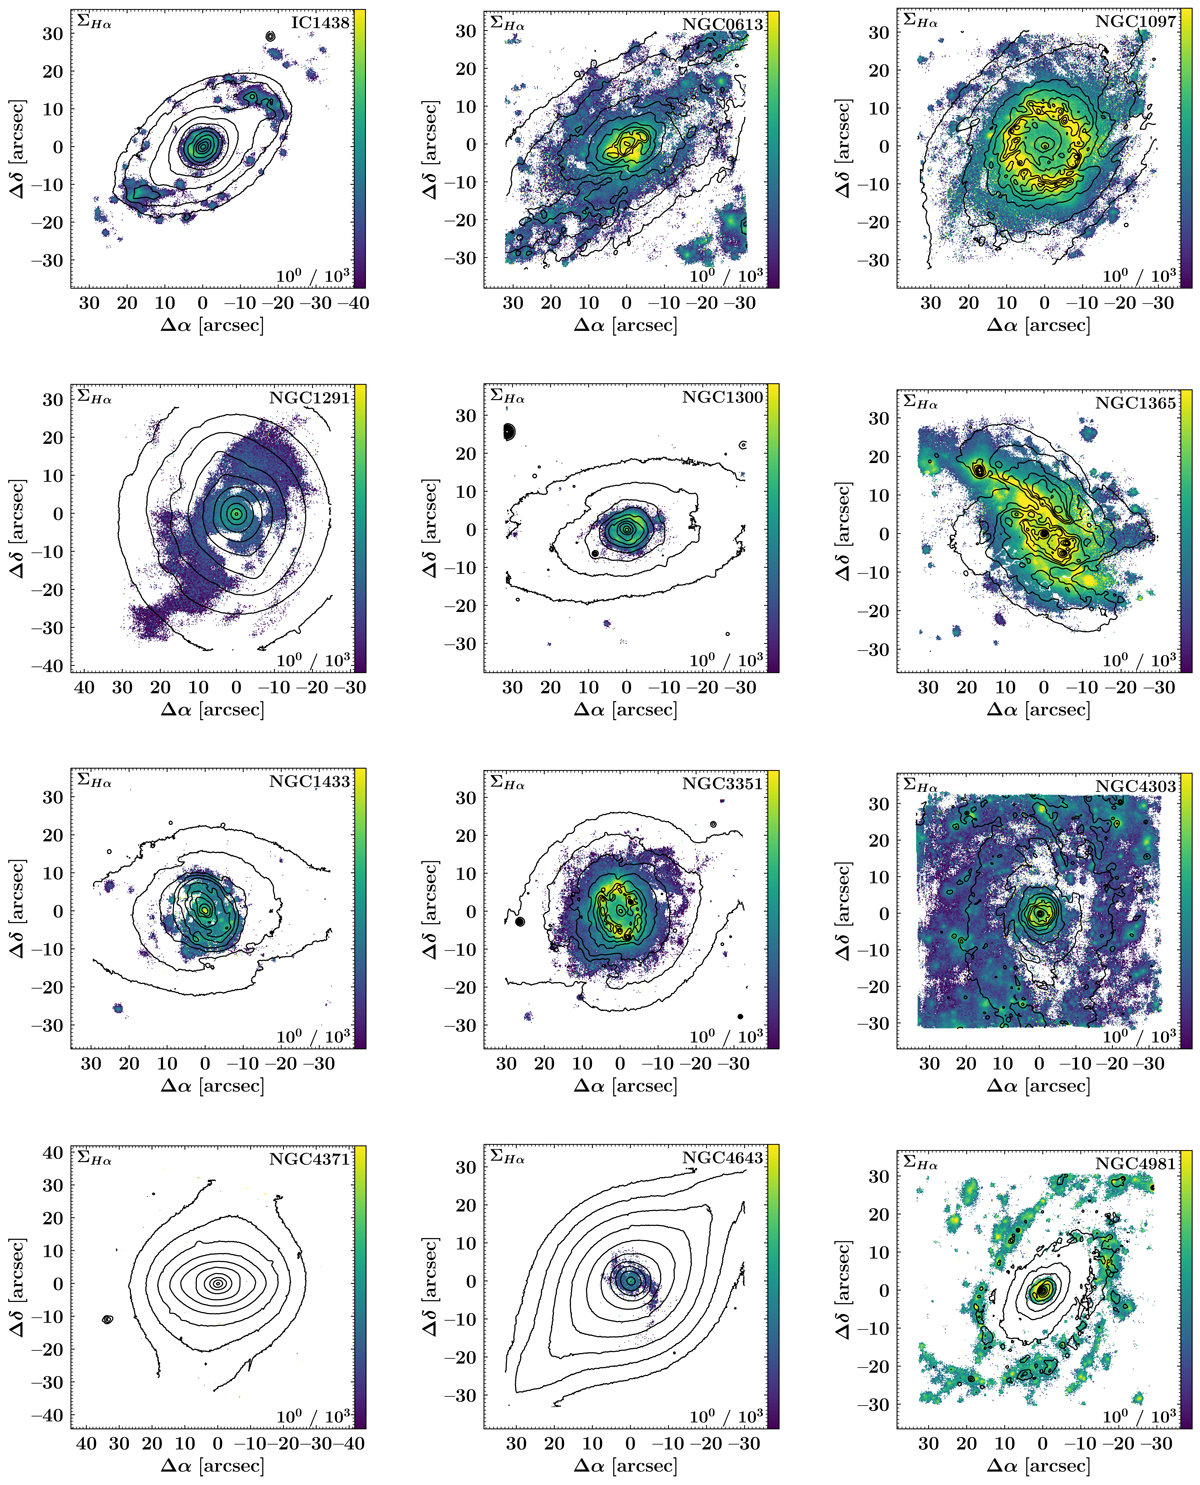
Maps of dust-corrected Hα fluxes for all TIMER galaxies. We note that only spaxels with an Hα amplitude-over-noise ratio above 5 are displayed. Fluxes are given in units of 10−12 erg s−1 cm−2 arcsec−2 and the respective limits of the colour bar are stated in the lower-right corner of each panel. Based on reconstructed intensities from the MUSE cube, we display isophotes in steps of 0.5 mag, identical to the ones displayed in the maps of the stellar population properties. North is up; east is to the left.
Current usage metrics show cumulative count of Article Views (full-text article views including HTML views, PDF and ePub downloads, according to the available data) and Abstracts Views on Vision4Press platform.
Data correspond to usage on the plateform after 2015. The current usage metrics is available 48-96 hours after online publication and is updated daily on week days.
Initial download of the metrics may take a while.