Fig. 6.
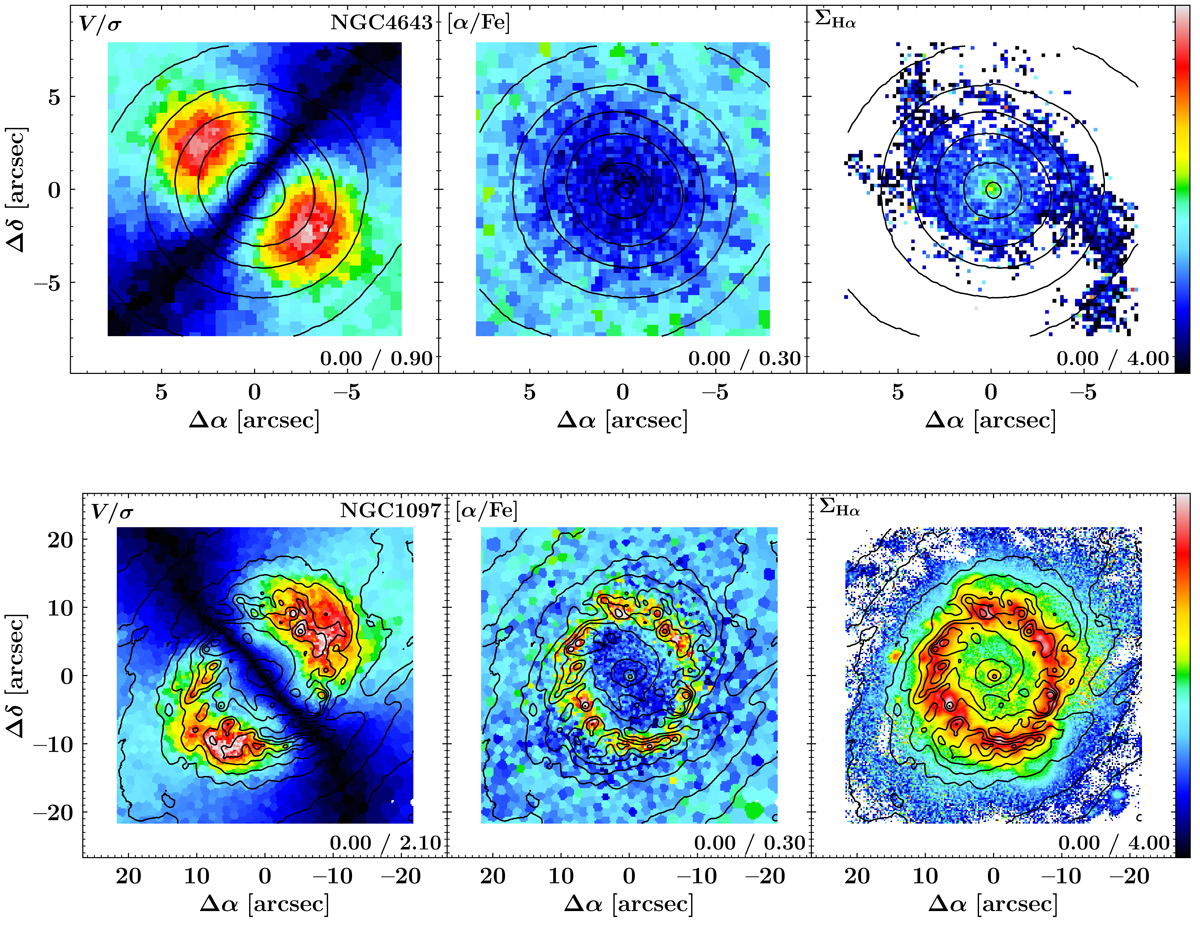
Maps of V/σ (left-hand panels), [α/Fe] abundances (centre panels), and Hα emission-line fluxes (right-hand panels) of the galaxies NGC 4643 from the non-star-forming subsample (upper panels) and NGC 1097 from the star-forming subsample (lower panels). The maps do not display the full MUSE field of view, but focus on the region of the nuclear discs. The limits of the colour bar are stated in the lower-right corner of each panel. Based on reconstructed intensities from the MUSE cube, we display isophotes in steps of 0.5 mag. North is up; east is to the left.
Current usage metrics show cumulative count of Article Views (full-text article views including HTML views, PDF and ePub downloads, according to the available data) and Abstracts Views on Vision4Press platform.
Data correspond to usage on the plateform after 2015. The current usage metrics is available 48-96 hours after online publication and is updated daily on week days.
Initial download of the metrics may take a while.