Fig. 4.
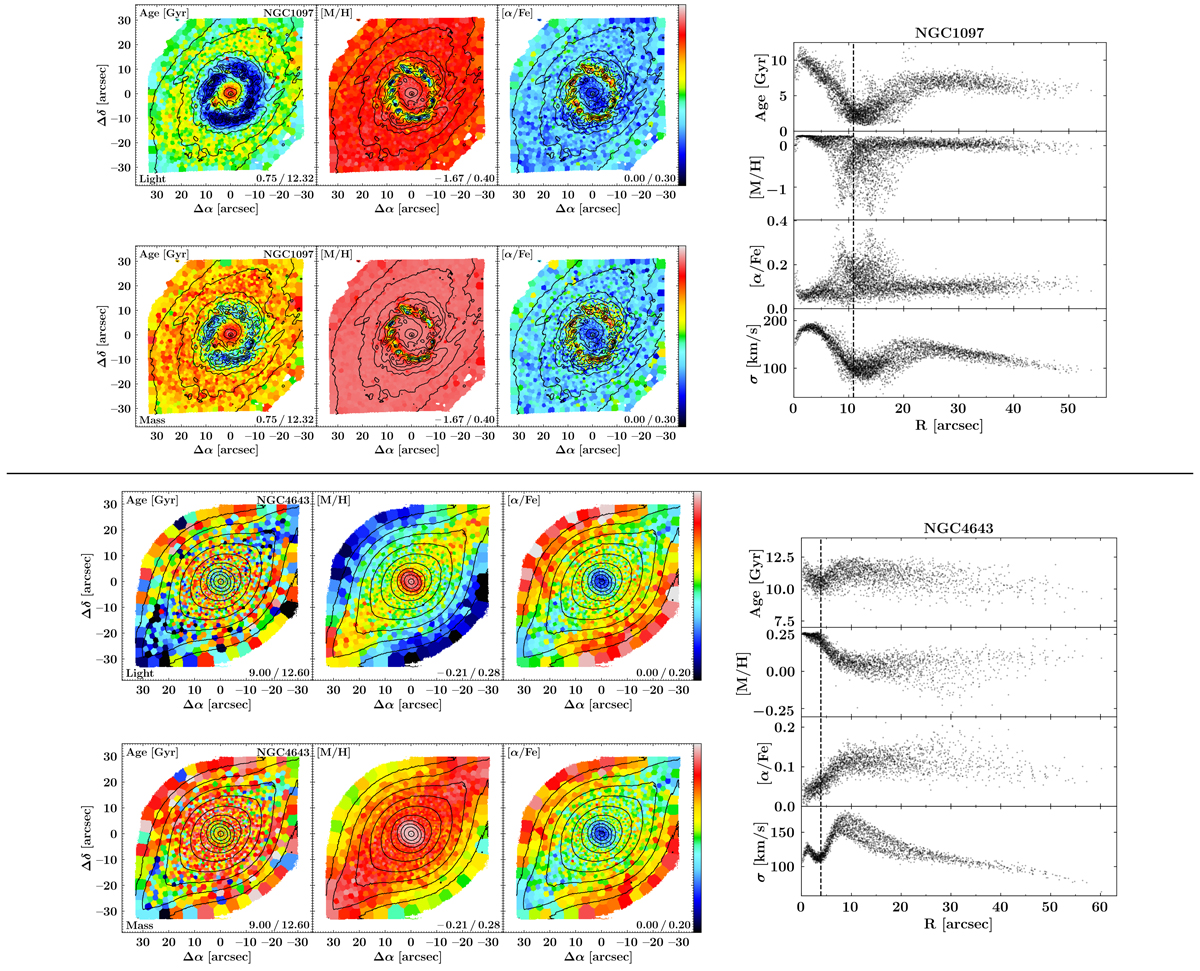
Left: maps of the mean stellar population properties of NGC 1097 from the star-forming subsample (upper half) and NGC 4643 from the non-star-forming subsample (lower half). We present for each galaxy the light-weighted (upper panels) and mass-weighted (lower panels) population content. The maps have been generated with pPXF and include the modelling of [α/Fe] abundances. The figures display age, [M/H], and [α/Fe] enhancements in the left-hand, centre, and right-hand panels, respectively. The limits of the colour bar are stated in the lower-right corner of each panel. Based on reconstructed intensities from the MUSE cube, we display isophotes in steps of 0.5 mag. North is up; east is to the left. Right: radial profiles of light-weighted stellar ages (first panels), metallicities (second panels), [α/Fe] enhancements (third panels), and velocity dispersions (fourth panels) as a function of the galactocentric radius of all spatial bins in the field of view. The profiles have been deprojected using inclinations and position angles derived in S4G (Muñoz-Mateos et al. 2015), as presented in Table 1. The vertical dashed lines represent the kinematic radii of the nuclear discs, which was defined in G20 as the radius at which V/σ reaches its maximum in the region dominated by the nuclear disc.
Current usage metrics show cumulative count of Article Views (full-text article views including HTML views, PDF and ePub downloads, according to the available data) and Abstracts Views on Vision4Press platform.
Data correspond to usage on the plateform after 2015. The current usage metrics is available 48-96 hours after online publication and is updated daily on week days.
Initial download of the metrics may take a while.