Fig. 3.
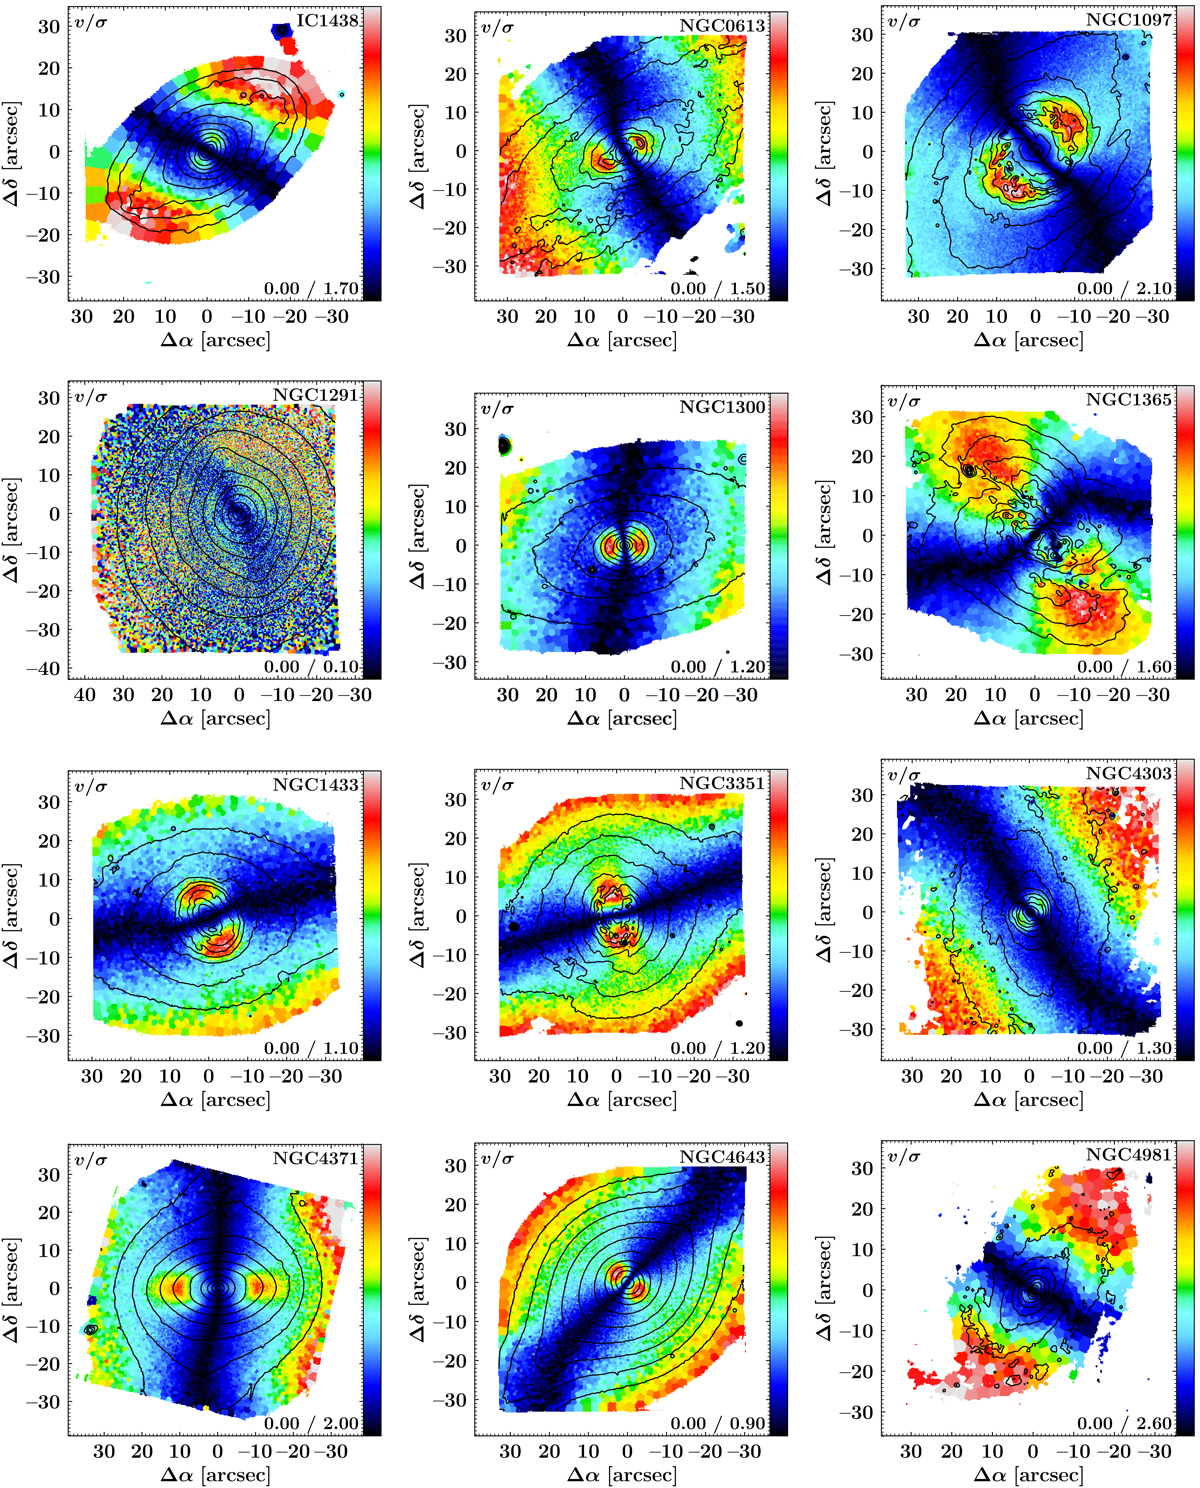
Maps of v/σ for the stellar components in the TIMER galaxies, as indicated. The plotted range is indicated on the bottom right corner. The isophotes shown are derived from the MUSE data cube reconstructed intensities and are equally spaced in steps of about 0.5 mag. On average, 1″ corresponds to ≈100 pc. North is up, east to the left.
Current usage metrics show cumulative count of Article Views (full-text article views including HTML views, PDF and ePub downloads, according to the available data) and Abstracts Views on Vision4Press platform.
Data correspond to usage on the plateform after 2015. The current usage metrics is available 48-96 hours after online publication and is updated daily on week days.
Initial download of the metrics may take a while.