Open Access
Fig. 4
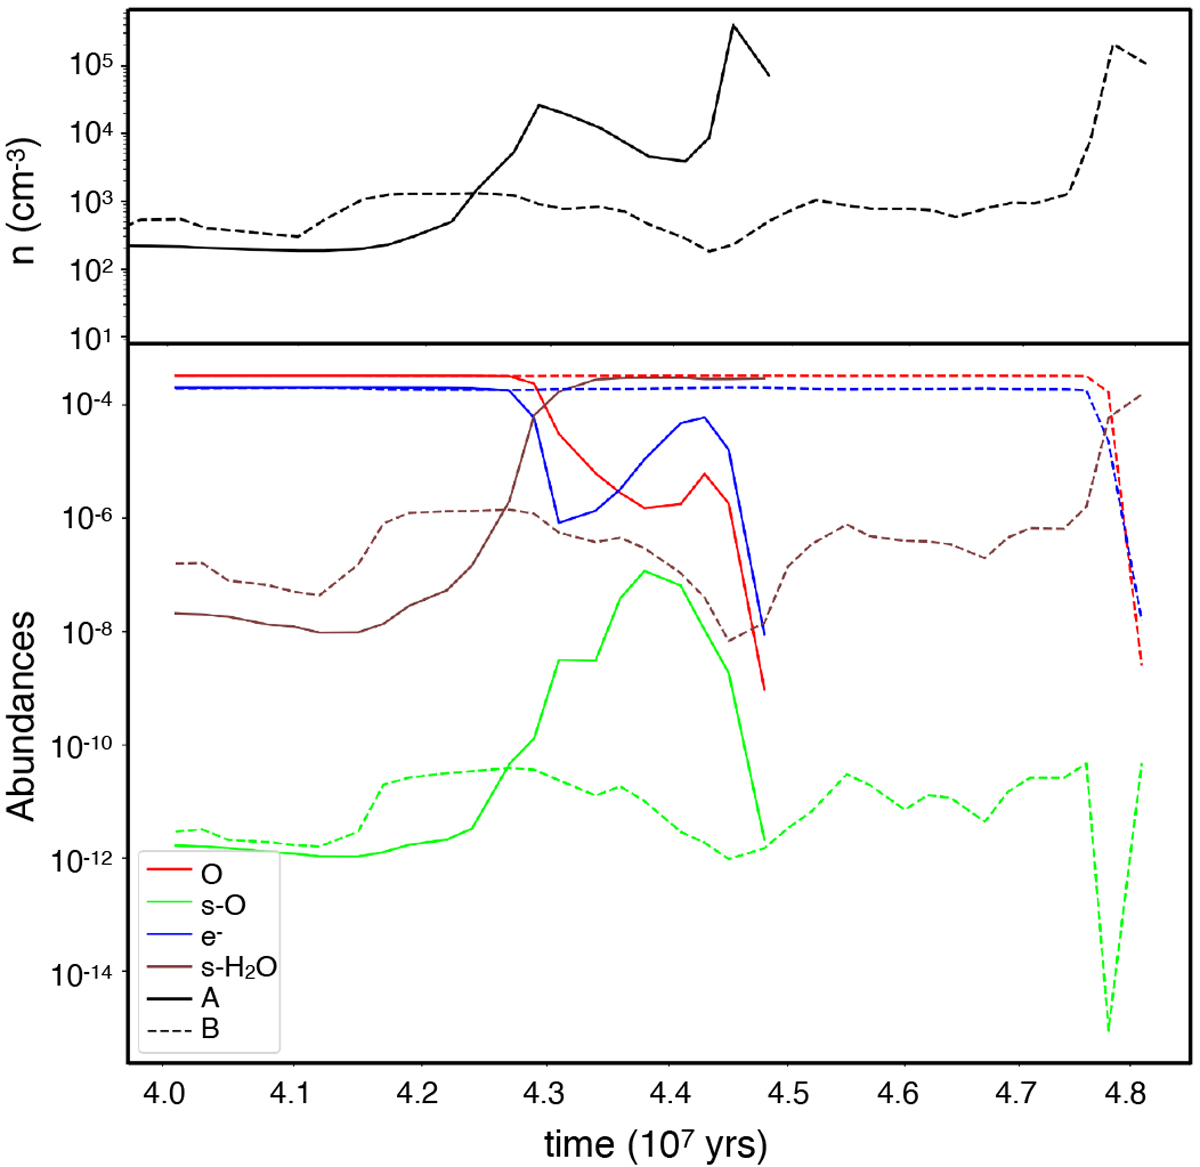
Upper panel: evolution of the density of the two SPH simulations of the formation of dense cores between 4 × 10⁷ and 5 × 10⁷ yr (solid line for case A, dashed line for case B). Lower panel: evolution of the abundance of O (red), s-O (green), e− (blue), and s-H2O (brown) for cloud A (solid lines) and cloud B (dashed lines).
Current usage metrics show cumulative count of Article Views (full-text article views including HTML views, PDF and ePub downloads, according to the available data) and Abstracts Views on Vision4Press platform.
Data correspond to usage on the plateform after 2015. The current usage metrics is available 48-96 hours after online publication and is updated daily on week days.
Initial download of the metrics may take a while.