Free Access
Fig. 8.
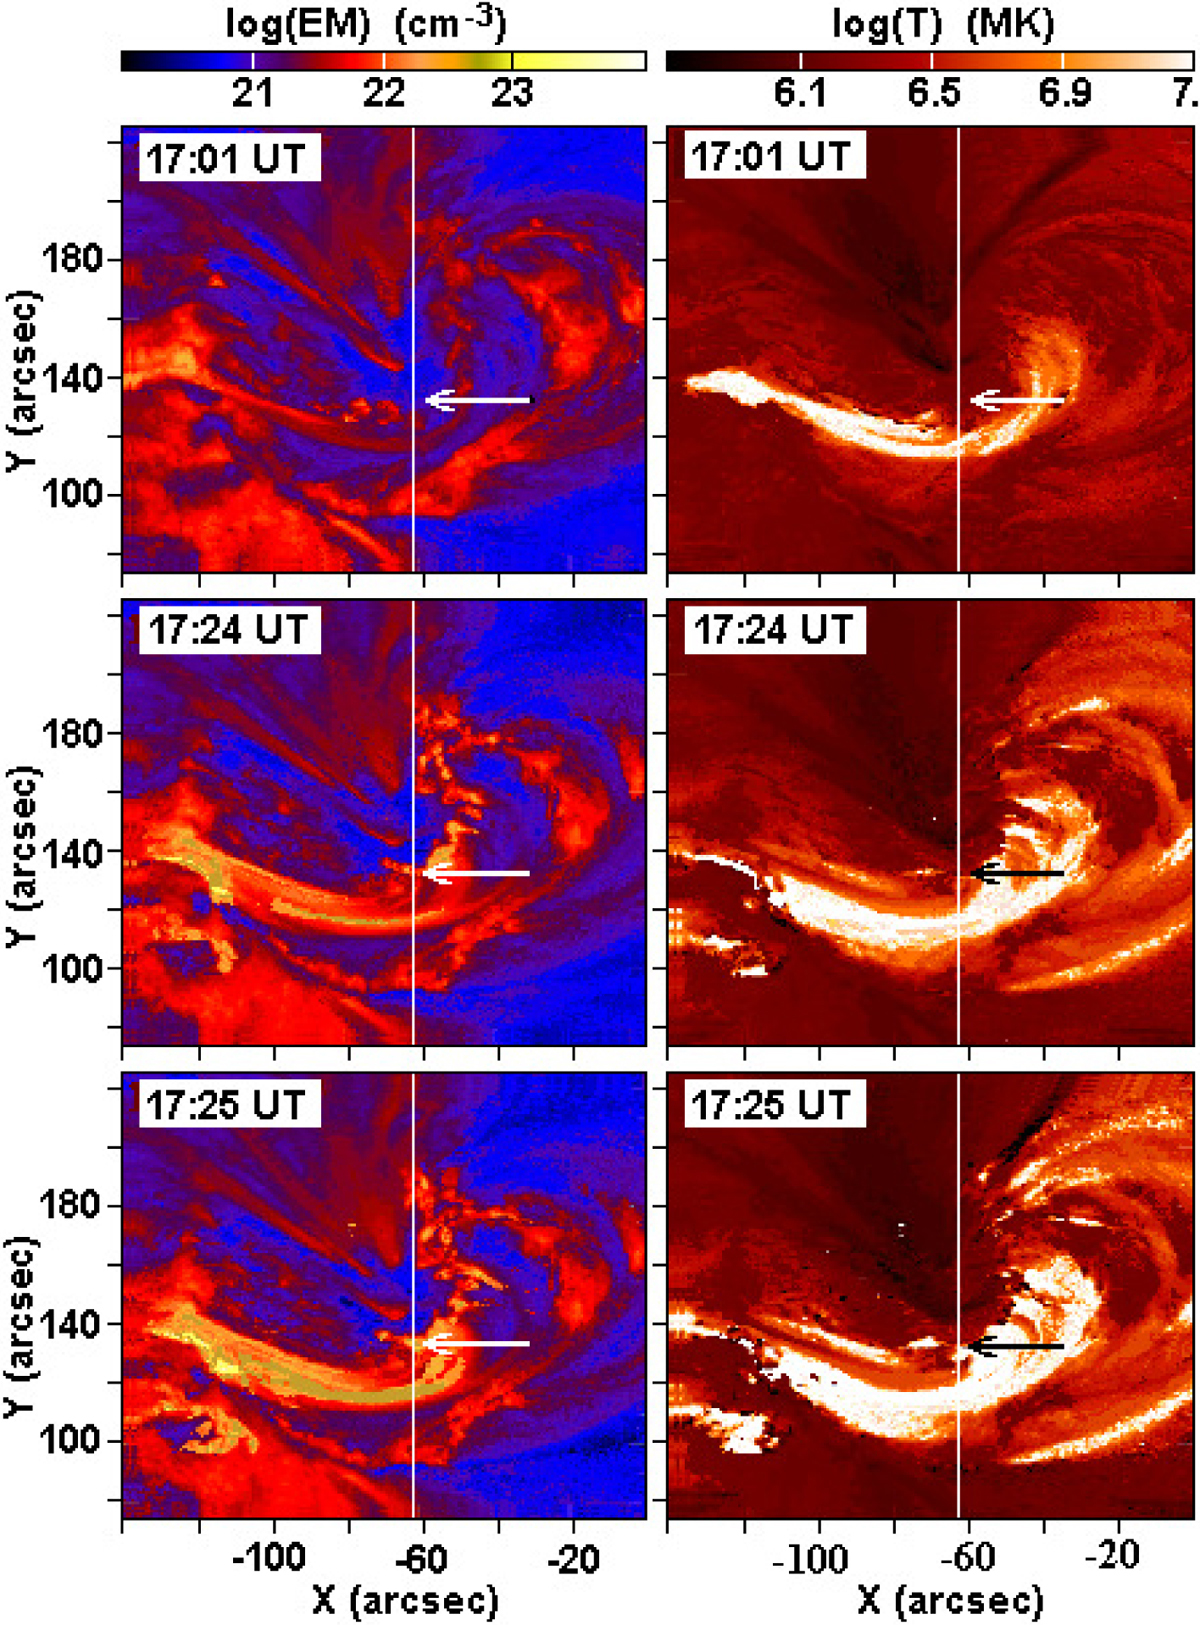
Coronal AIA filtergrams at 17:01, 17:24, and 17:25 UT. Extrapolated parameters of emission measure EM and temperature T of the sunspot region. Vertical lines show the X = −62″ slit position. Arrows display the Y = 132″position and the initial impulse location at 17:25 UT (bright blob).
Current usage metrics show cumulative count of Article Views (full-text article views including HTML views, PDF and ePub downloads, according to the available data) and Abstracts Views on Vision4Press platform.
Data correspond to usage on the plateform after 2015. The current usage metrics is available 48-96 hours after online publication and is updated daily on week days.
Initial download of the metrics may take a while.