Fig. 7.
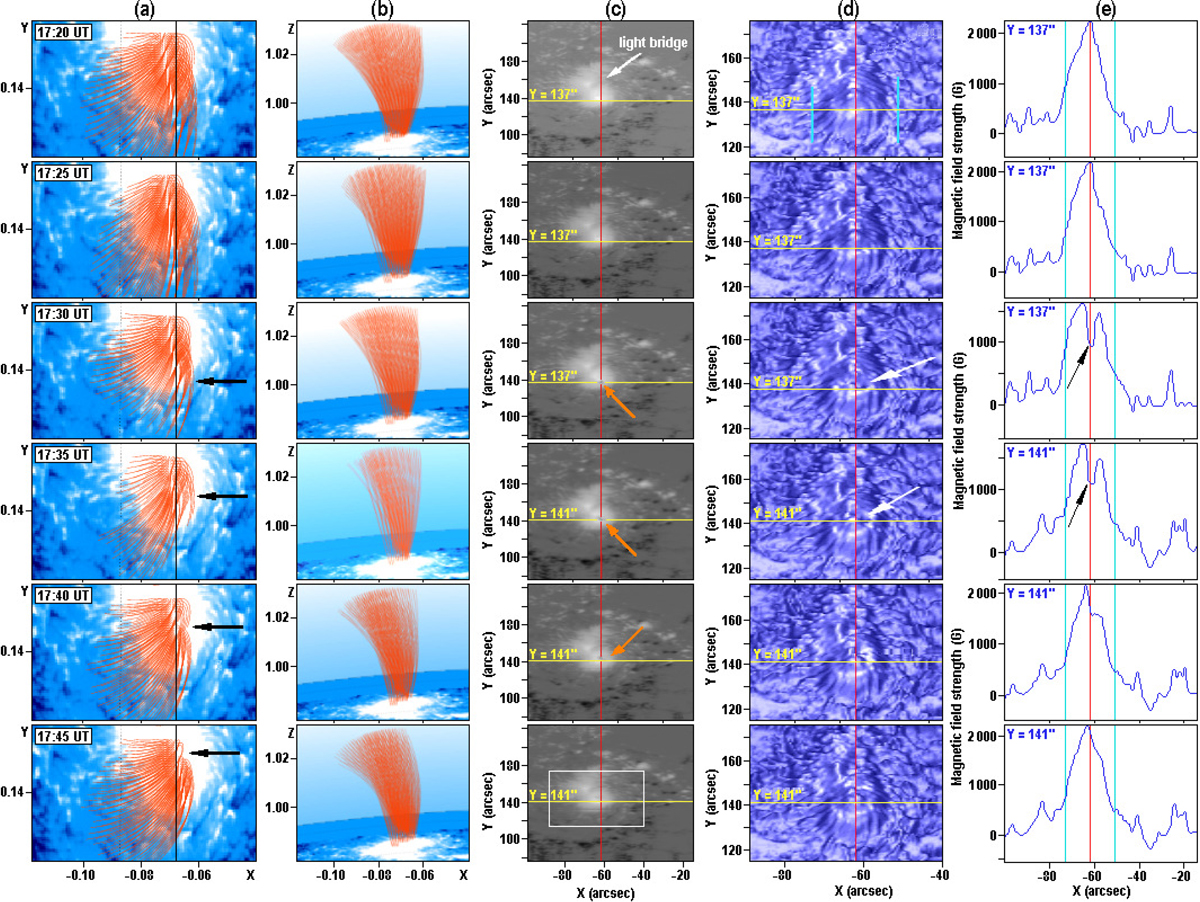
Magnetically coupled atmosphere and magnetic field reconnection forced by passing tadpole wave (UT times (a) are related to individual rows of plots). Magnetic field perturbations are marked by arrows (except 17:20 UT, (c)). The slit position X = −62″ is displayed by vertical red lines. (a)–(b): The blue background represents the Bz HMI magnetograms. The best-fit magnetic field lines (orange curves) were computed for AIA 1600Å with the VCA-NLFFF code: Footpoints are in a 150 × 150 grid, field strength of |Bz| > 180 G. The field lines were obtained from line-of-sight angles ((a)) and the 90 deg rotated to north angles ((b)). (c)–(e): Evolution of magnetic field perturbation in SDO/HMI magnetograms. Dark mottles (orange arrows, (c)) show that places of magnetic field strength decrease. The magnetic field strength distributions ((d)) exhibit a hill shape. They are related to the area size (white rectangle, (c)). The magnetic field strength profiles ((e)) are at selected positions (yellow horizontal lines, (c)–(d)). The SDO/AIA 1700Å waveguide width is marked by vertical cyan lines ((d)–(e)).
Current usage metrics show cumulative count of Article Views (full-text article views including HTML views, PDF and ePub downloads, according to the available data) and Abstracts Views on Vision4Press platform.
Data correspond to usage on the plateform after 2015. The current usage metrics is available 48-96 hours after online publication and is updated daily on week days.
Initial download of the metrics may take a while.