Free Access
Fig. 4.
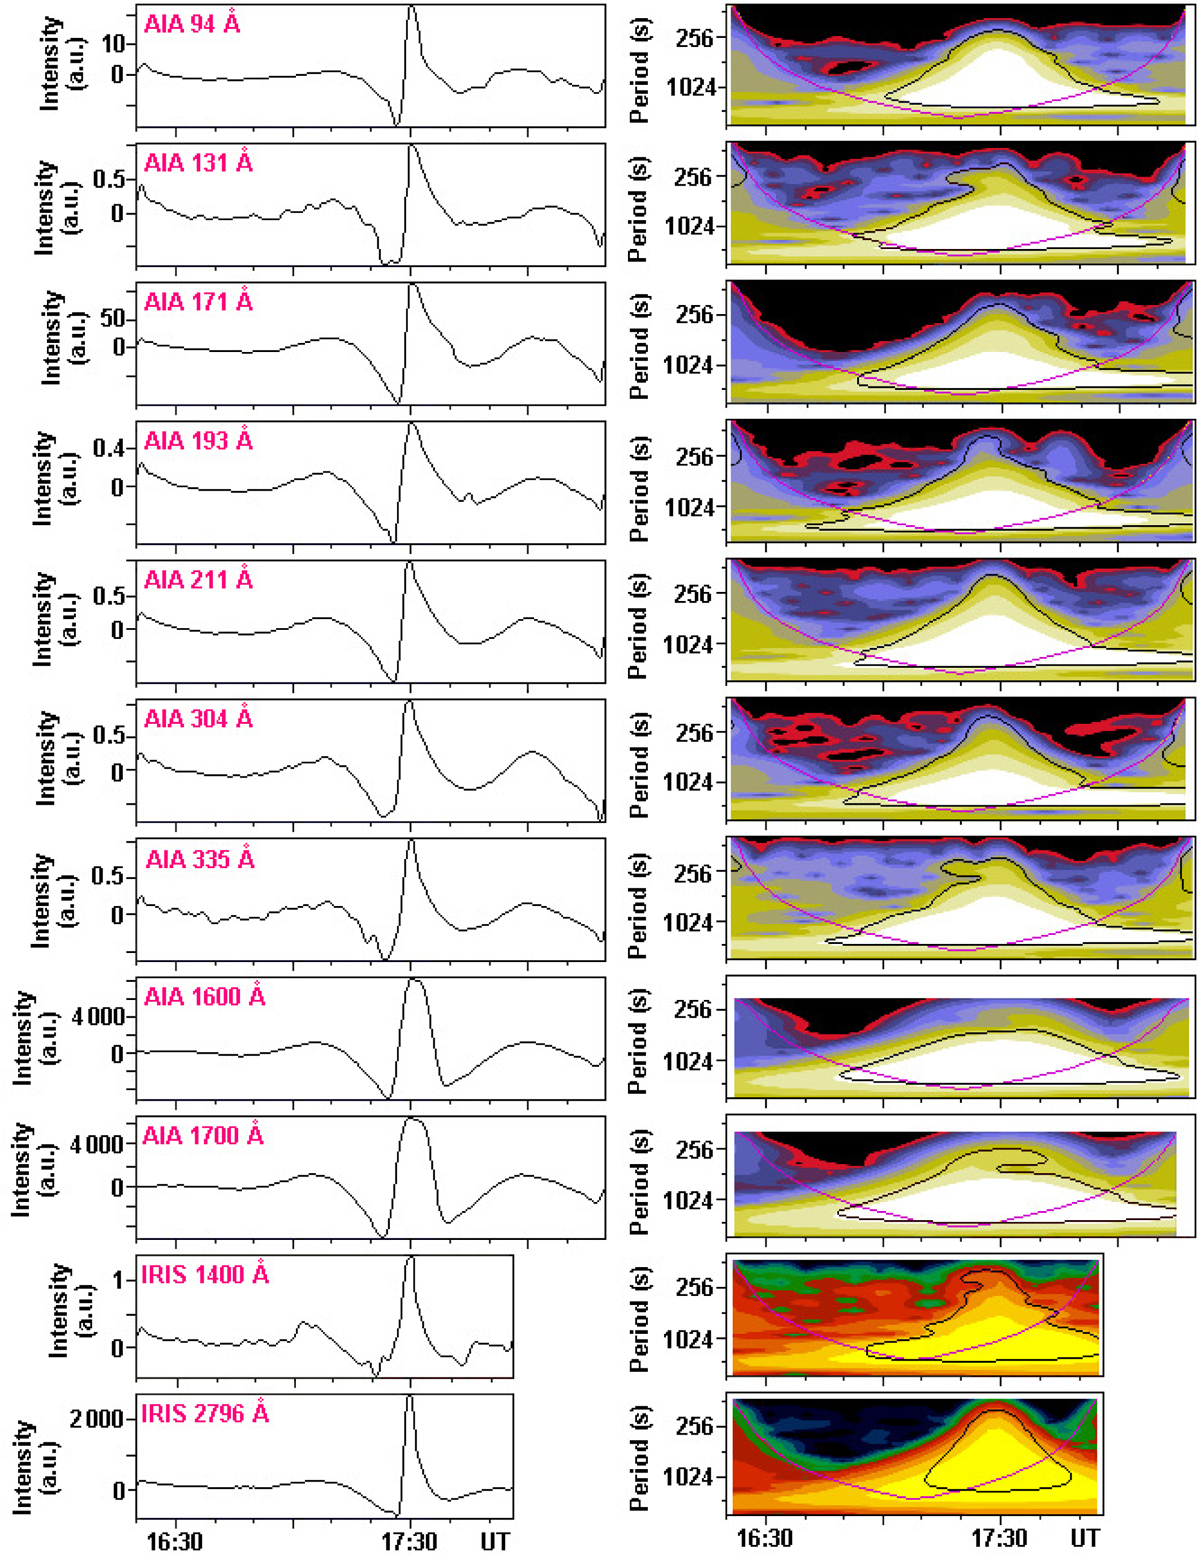
Common behaviour of cylindrical tadpole waves in (E)UV observables determined at the X = −62″ slit. Selected time series observed at Y = 139″ (left column) and their corresponding wavelet power spectra (right column) with the cylindrical tadpole wave patterns (lighter areas) of 99% significance (black contours).
Current usage metrics show cumulative count of Article Views (full-text article views including HTML views, PDF and ePub downloads, according to the available data) and Abstracts Views on Vision4Press platform.
Data correspond to usage on the plateform after 2015. The current usage metrics is available 48-96 hours after online publication and is updated daily on week days.
Initial download of the metrics may take a while.