Fig. 3.
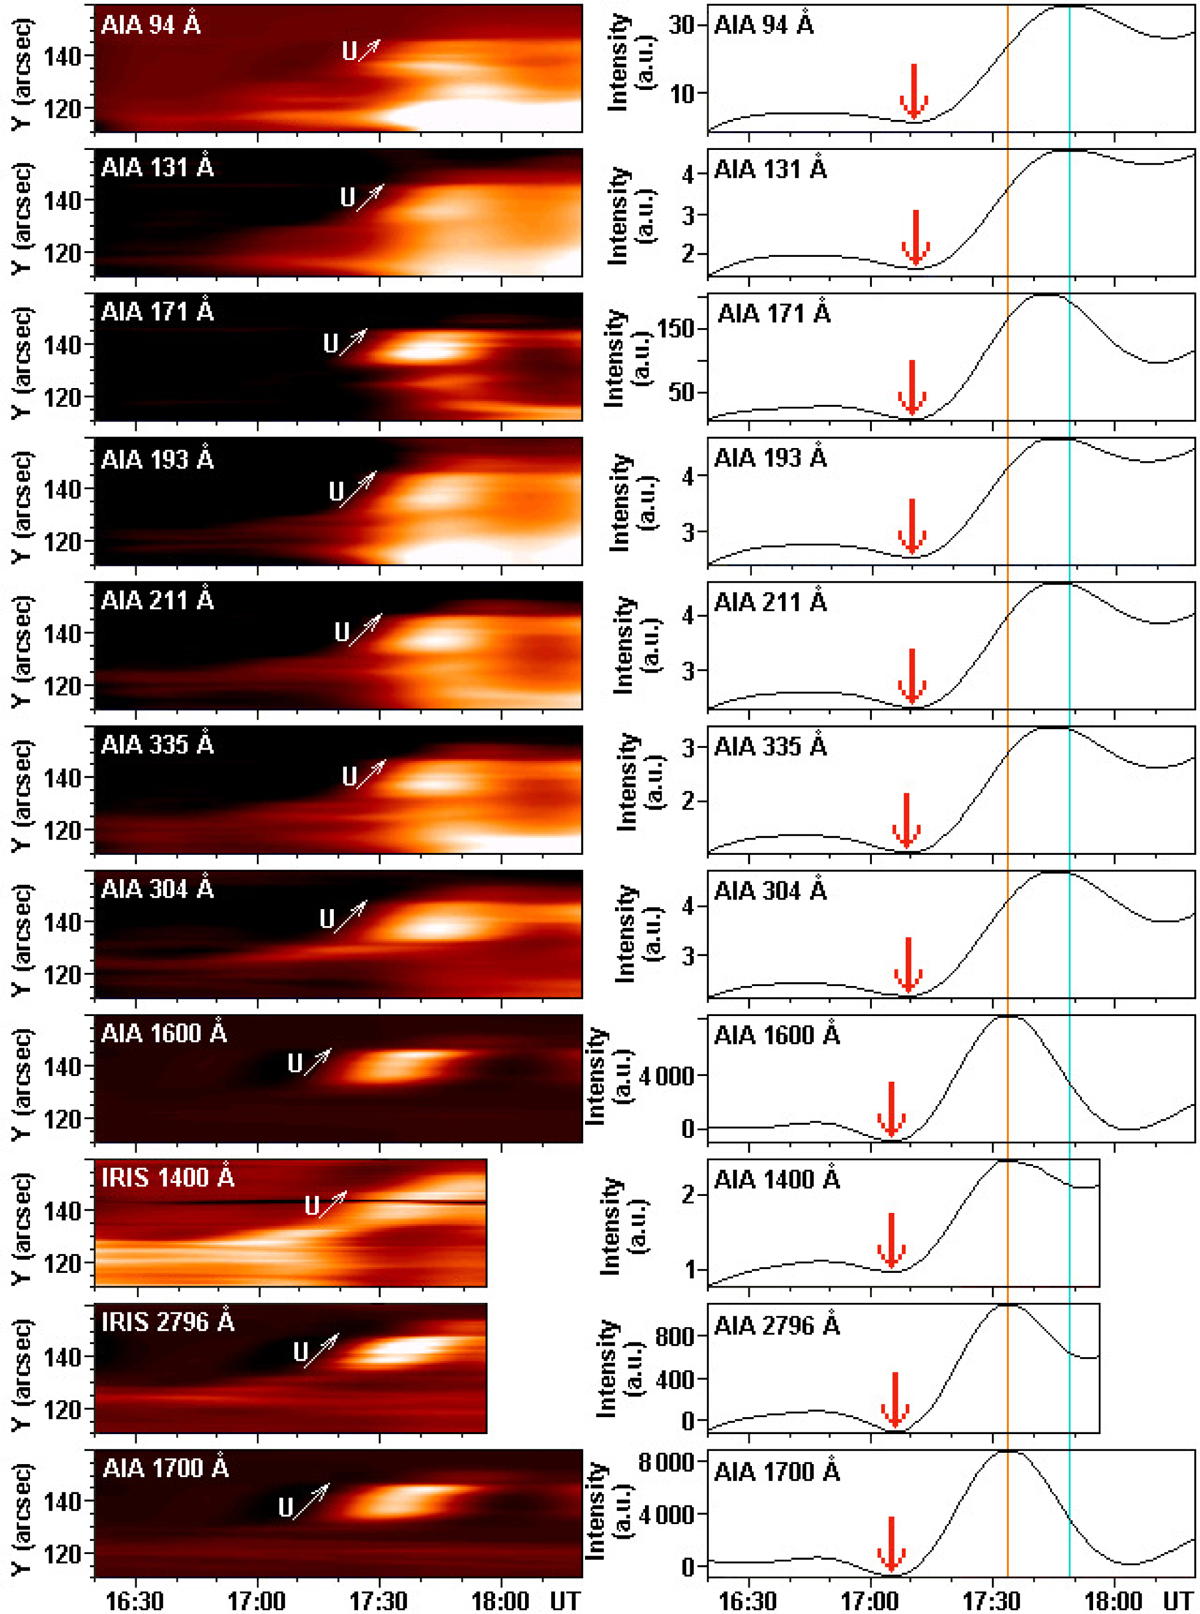
Common behaviour of separated (E)UV steady plasma flows determined at the X = −62″ slit. Flow speed U is marked by arrows. Vertical lines in selected flow time series at Y = 139″ (right panels) show the time of an emission maximum at AIA 1700 (orange) and 94Å observables (cyan). The red arrows show the starting times of the plasma flow onsets.
Current usage metrics show cumulative count of Article Views (full-text article views including HTML views, PDF and ePub downloads, according to the available data) and Abstracts Views on Vision4Press platform.
Data correspond to usage on the plateform after 2015. The current usage metrics is available 48-96 hours after online publication and is updated daily on week days.
Initial download of the metrics may take a while.