Fig. 2.
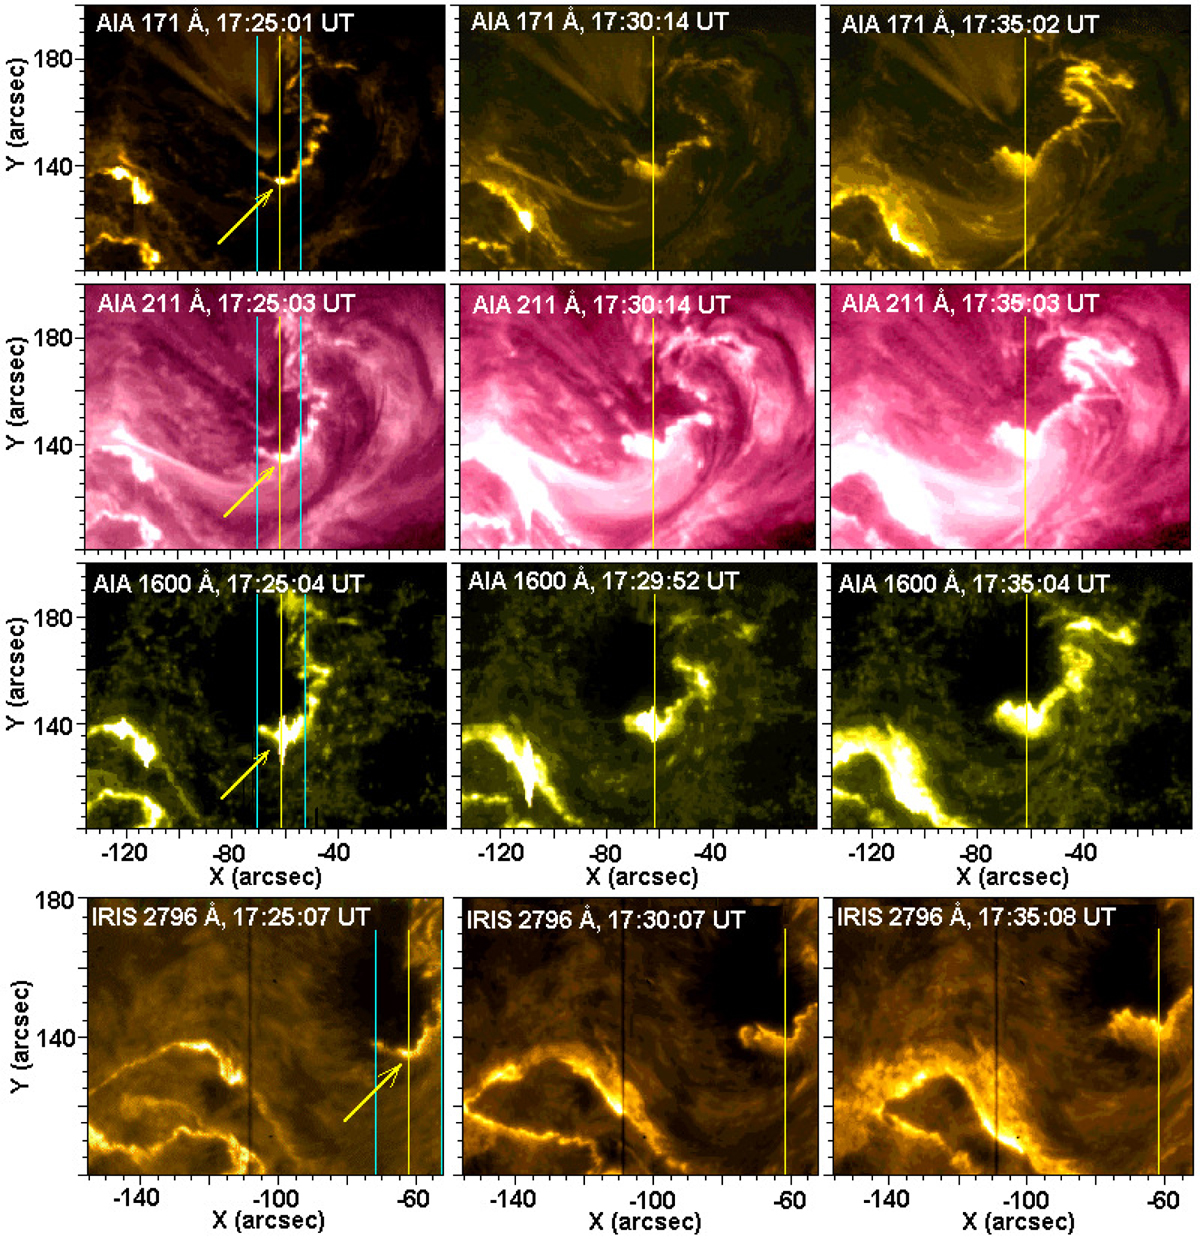
Temporal examples of observed SDO/AIA 171, 211, 1600Å, and IRIS 2796Å emissions above the sunspot. The artificial slit position of X = −62″, the IRIS spectrograph slit, and the positions of waveguide margins are displayed in yellow, black, and cyan vertical lines, respectively. Locations of tadpole wave triggering (bright blobs) are marked by arrows.
Current usage metrics show cumulative count of Article Views (full-text article views including HTML views, PDF and ePub downloads, according to the available data) and Abstracts Views on Vision4Press platform.
Data correspond to usage on the plateform after 2015. The current usage metrics is available 48-96 hours after online publication and is updated daily on week days.
Initial download of the metrics may take a while.