Fig. A.2.
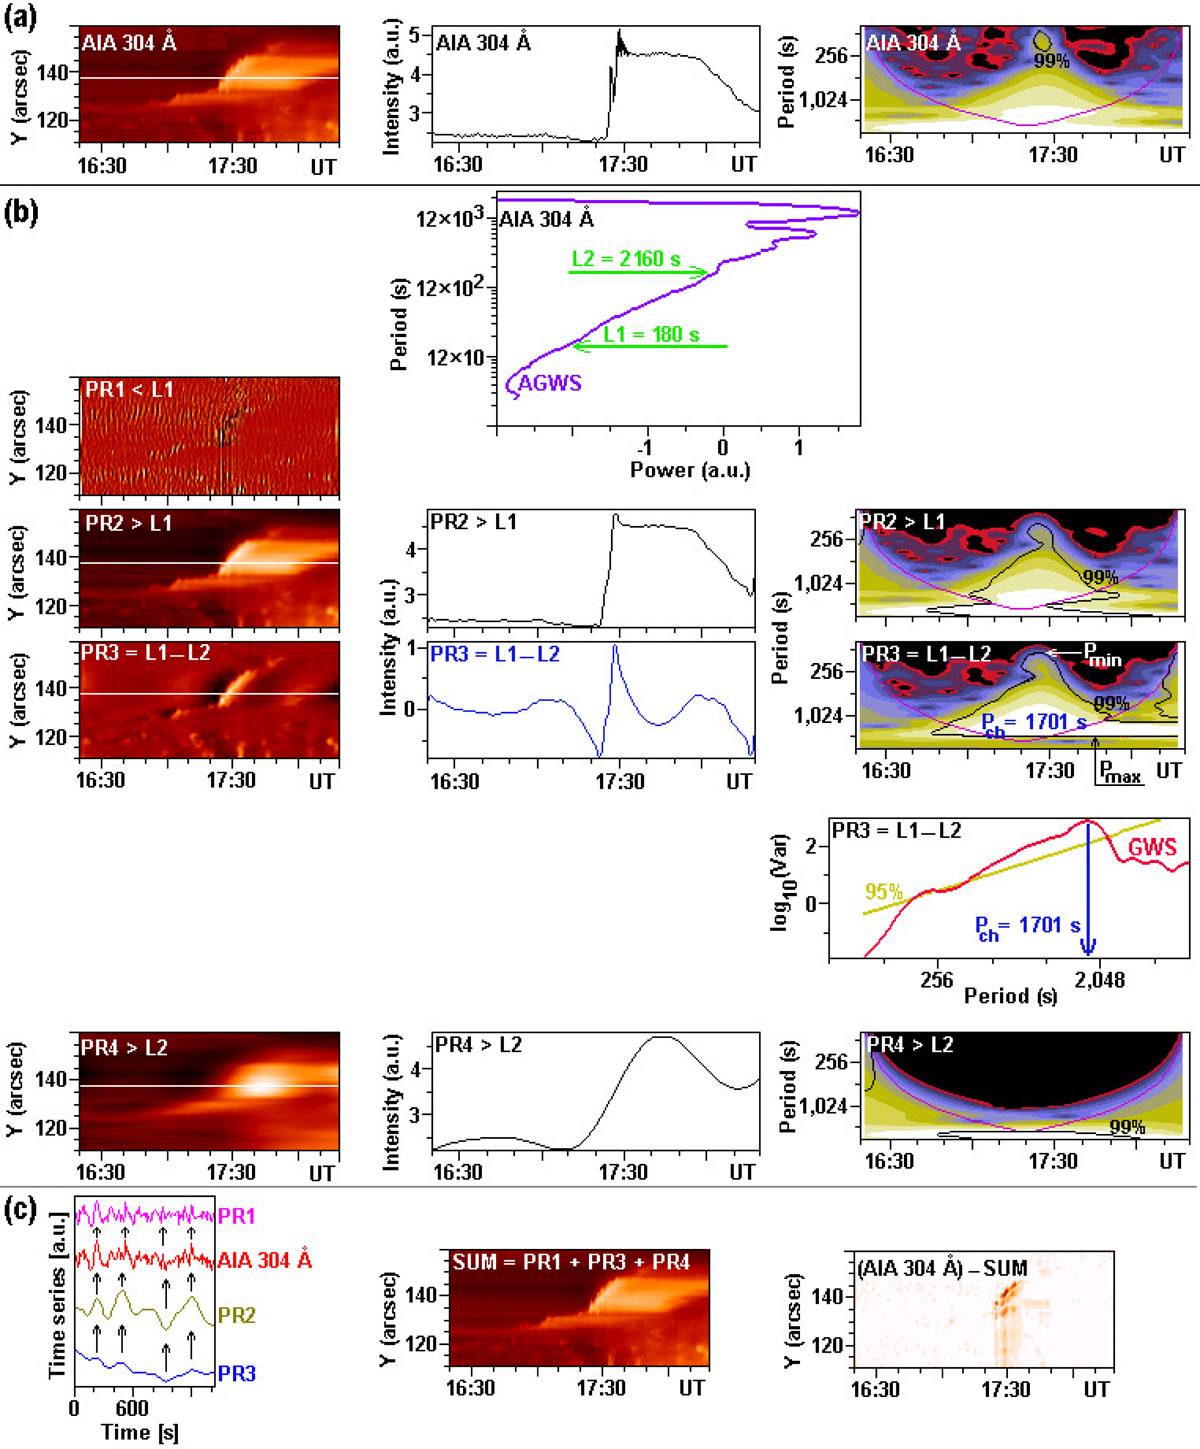
WASEM separation of the observed space-time diagram SDO/AIA 304Å ((a)) with selected time series at Y = 138″and wavelet power spectrum. Part b: averaged global wavelet spectrum AGWS with L1 − L2 limits. Separated space-time diagrams according to period range PR1 − PR4 (PR3 and PR4 with the tadpole wave and the plasma flow propagation, respectively). Global wavelet spectrum (GWS) determined a characteristic period Pch above the global 95% significance level curve. WASEM analysis validity tests (part c).
Current usage metrics show cumulative count of Article Views (full-text article views including HTML views, PDF and ePub downloads, according to the available data) and Abstracts Views on Vision4Press platform.
Data correspond to usage on the plateform after 2015. The current usage metrics is available 48-96 hours after online publication and is updated daily on week days.
Initial download of the metrics may take a while.