Fig. 1.
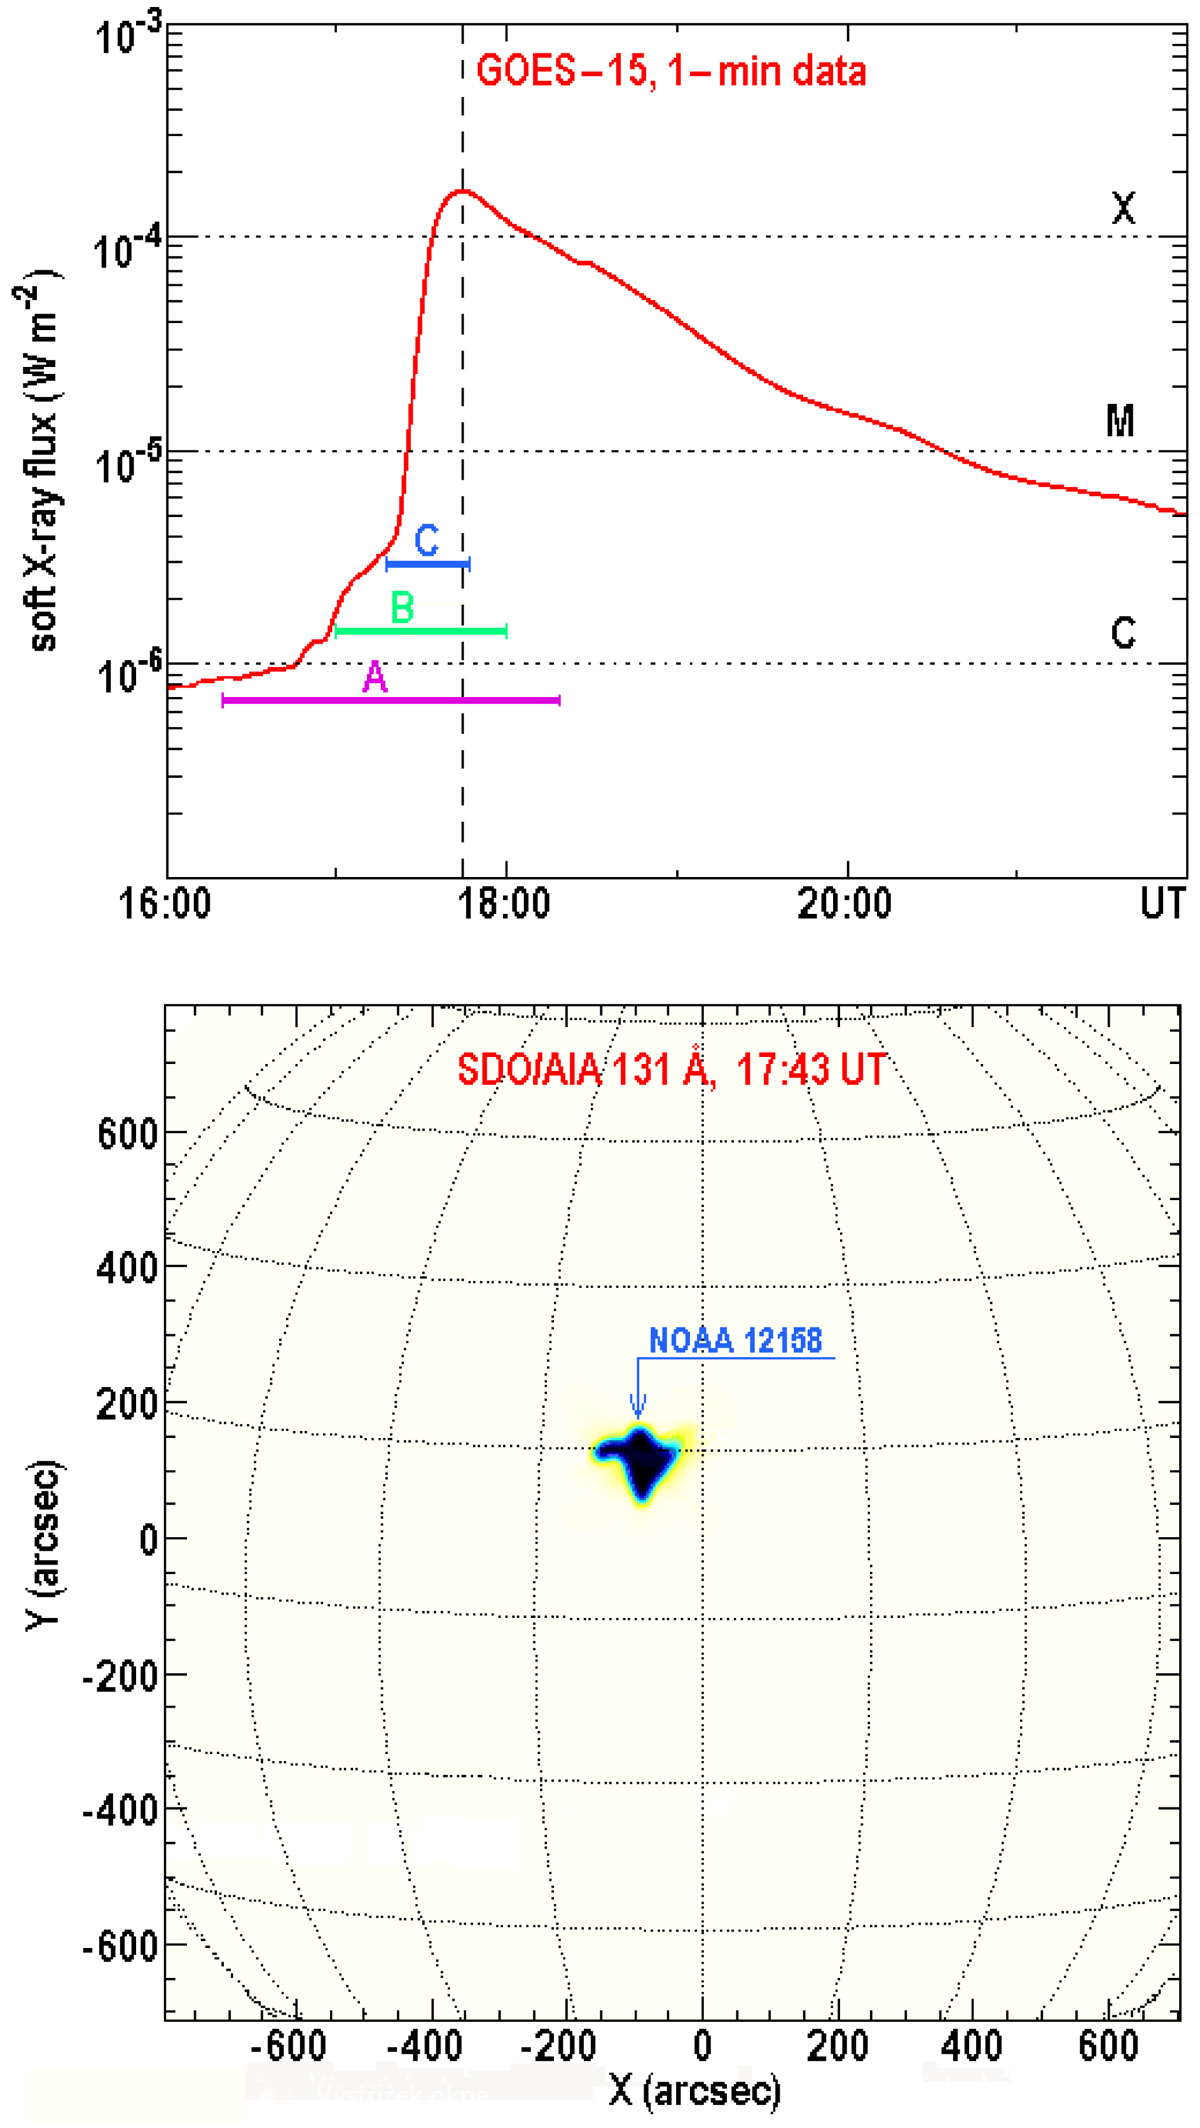
Upper panel: GOES-15 soft X-ray flux reached its maximum at 17:45 UT (red curve). The examined time interval 16:20–18:20 UT, the occurrence of the steady plasma flows (17:00–≈18:00 UT), and the tadpole waves (17:19–17:48 UT) are indicated by bars A, B, and C, respectively. Bottom panel: location of the flare NOAA 12158 near the solar disc centre observed by SDO/AIA 131Å at 17:43 UT.
Current usage metrics show cumulative count of Article Views (full-text article views including HTML views, PDF and ePub downloads, according to the available data) and Abstracts Views on Vision4Press platform.
Data correspond to usage on the plateform after 2015. The current usage metrics is available 48-96 hours after online publication and is updated daily on week days.
Initial download of the metrics may take a while.