Fig. 6
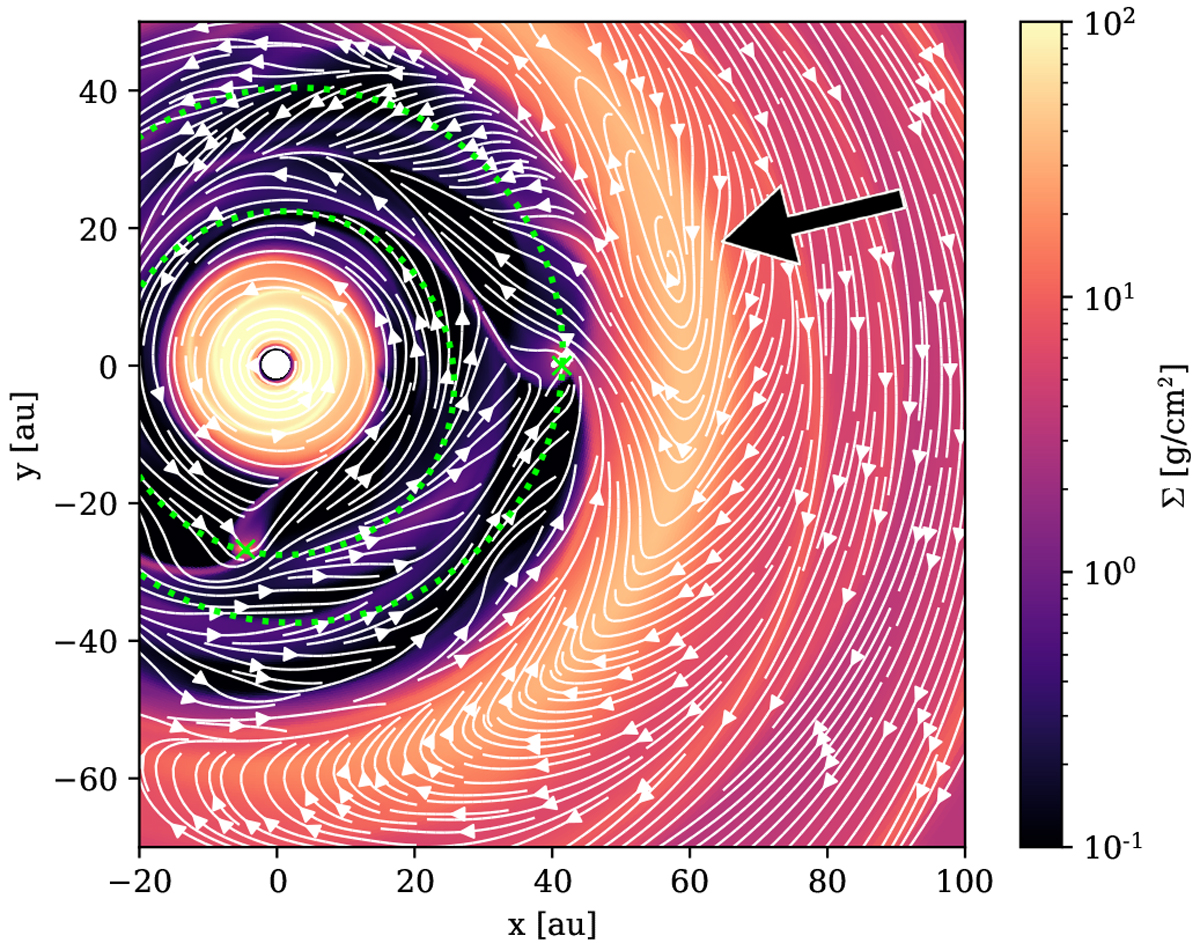
Zoom-in on panel b of Fig. 5 showing the surface density and velocity streamlines. The streamlines are computed in a frame corotating with the disc at 59 au. The streamlines are closed in the region indicated by the black arrow, showing that the overdensity is a vortex. The orbits of the planets are indicated as the green dotted lines.
Current usage metrics show cumulative count of Article Views (full-text article views including HTML views, PDF and ePub downloads, according to the available data) and Abstracts Views on Vision4Press platform.
Data correspond to usage on the plateform after 2015. The current usage metrics is available 48-96 hours after online publication and is updated daily on week days.
Initial download of the metrics may take a while.