Fig. 5
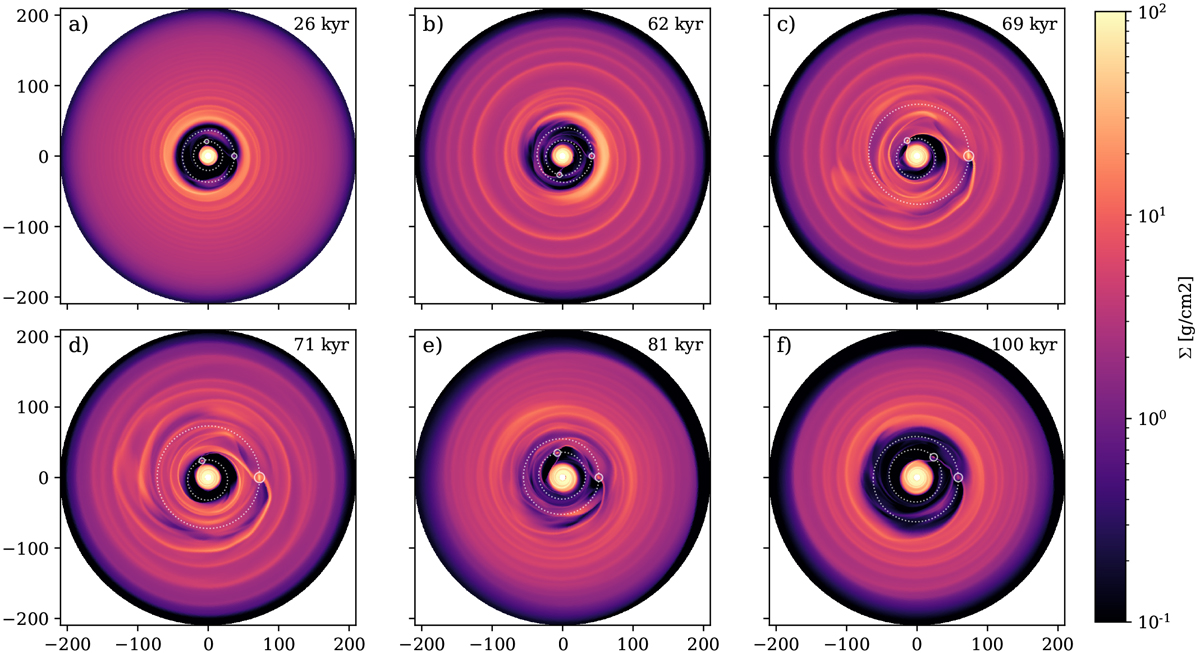
Snapshots of the surface density for model M9-3 showing the disc at different times: prior (panels a and b), during (c and d), and after (e and f) a migration jump. The current orbits of the two planets are marked by the dotted white ellipses and the planetary Hill spheres are indicated by the small circles. Coordinate labels show the position in au. The snapshots are rotated to have the outer planet fixed on the horizontal axis to the right of the origin. Time inside the simulation is shown in the upper right corner. The time of a particular snapshot in the time-line of the simulation can be located on the annotated vertical lines in Fig. 4. For synthetic observations of the snapshots, see Fig. 10.
Current usage metrics show cumulative count of Article Views (full-text article views including HTML views, PDF and ePub downloads, according to the available data) and Abstracts Views on Vision4Press platform.
Data correspond to usage on the plateform after 2015. The current usage metrics is available 48-96 hours after online publication and is updated daily on week days.
Initial download of the metrics may take a while.