Fig. C.1
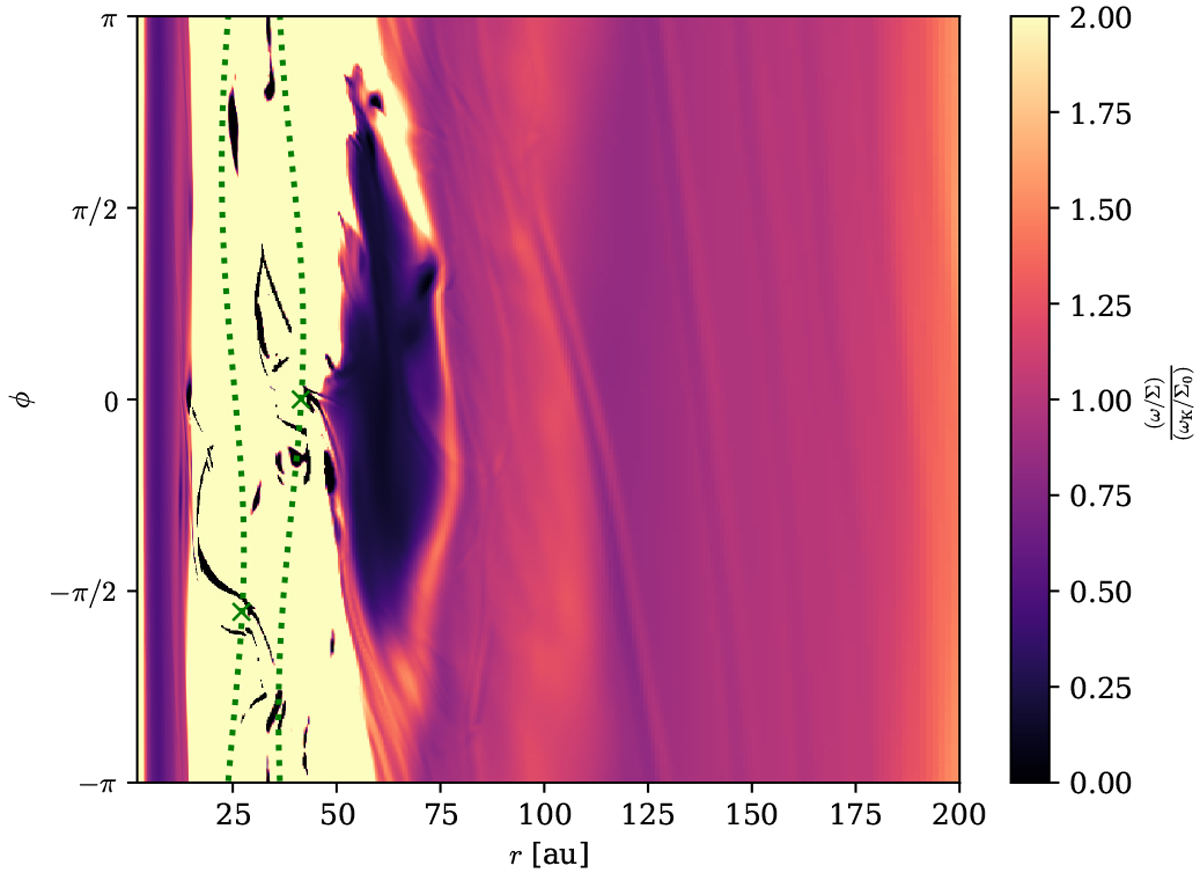
Vortensity normalized by the initial vortensity in r−ϕ coordinates for a ±100 au zoom-in to panel b of Fig. 5. The overdensity appears as a region of lower vortensity compared to its surroundings indicating that it is indeed a vortex. The orbits of the planets are shown as dotted green lines and the location of each planet is indicated by a small green cross symbol.
Current usage metrics show cumulative count of Article Views (full-text article views including HTML views, PDF and ePub downloads, according to the available data) and Abstracts Views on Vision4Press platform.
Data correspond to usage on the plateform after 2015. The current usage metrics is available 48-96 hours after online publication and is updated daily on week days.
Initial download of the metrics may take a while.