Fig. 12
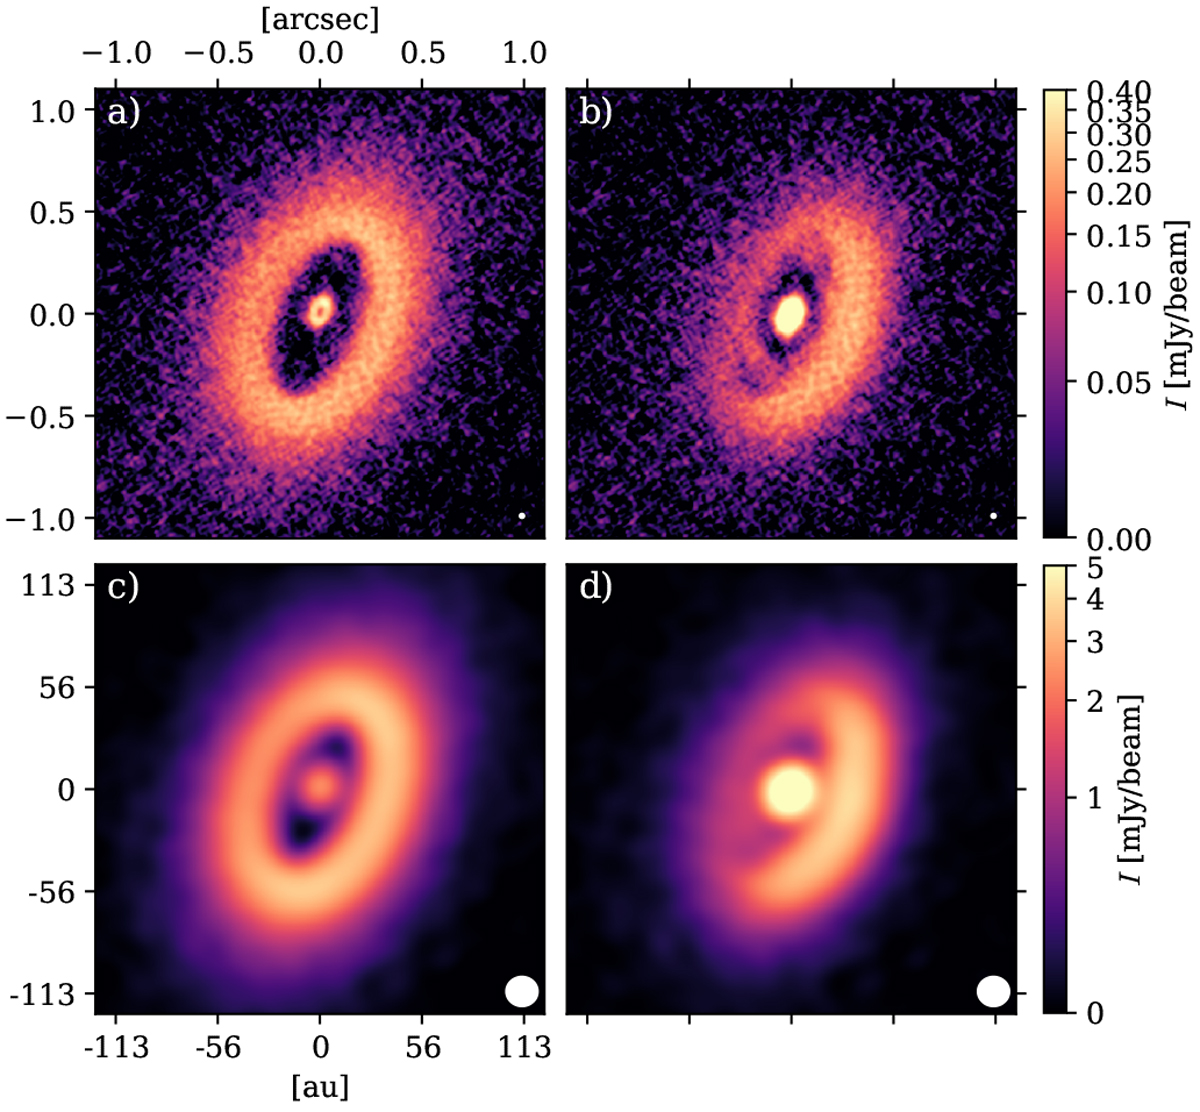
Synthetic observations of the PDS 70 models. Disc mass increases from left to right and resolution decreases from top to bottom. For a lower disc mass, the appearance is smooth and symmetric, showing a large gap. At higher disc mass, azimuthal asymmetries appear and additional substructures emerge for higher resolution. Left column (a and c): low-disc-mass model (PDS70 IRR M/5) at t = 70.3 kyr (see vertical line in Fig. 11) and right column (b and d): high-disc-mass model (PDS70 IRR) at the same point in time. Top row (a and b): generated with the same angular resolution as Fig. 10 while only the smaller ALMA antenna configuration was used for the bottom row (c and d), resulting in a larger beam size. The beam size is indicated in the bottom right corner of each image.
Current usage metrics show cumulative count of Article Views (full-text article views including HTML views, PDF and ePub downloads, according to the available data) and Abstracts Views on Vision4Press platform.
Data correspond to usage on the plateform after 2015. The current usage metrics is available 48-96 hours after online publication and is updated daily on week days.
Initial download of the metrics may take a while.