Fig. 10
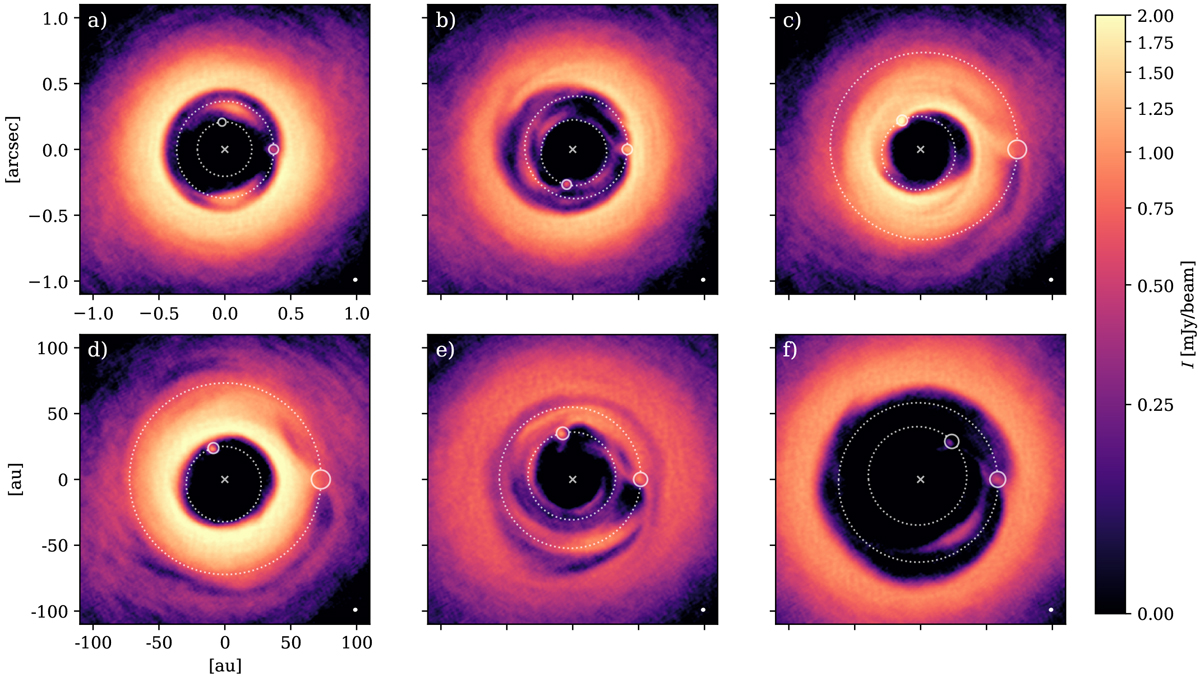
Synthetic ALMA observations at 855 μm of the disc in model M9-3 (assuming a distance of 100 pc) at different times: prior (a and b), during (c and d), and after (e and f) a migration jump. The panels coincide with the ones in Fig. 5 but they show the intensity from simulated observations instead of surface density and are zoomed-in to the inner ± 100 au of the disc. Coordinate ticks are the same in all panels and values are given in arcseconds in the top left panel and the corresponding values in au are shown in the bottom left panel. The ellipse in the bottom right corner of each panel indicates the beam size of 33 × 30 mas. The location of the star is indicated by the small cross symbol in the centre. The current orbits of the two planets are marked by the dotted white ellipses and the planetary Hill spheres are indicated by the small circles.
Current usage metrics show cumulative count of Article Views (full-text article views including HTML views, PDF and ePub downloads, according to the available data) and Abstracts Views on Vision4Press platform.
Data correspond to usage on the plateform after 2015. The current usage metrics is available 48-96 hours after online publication and is updated daily on week days.
Initial download of the metrics may take a while.