Fig. 1
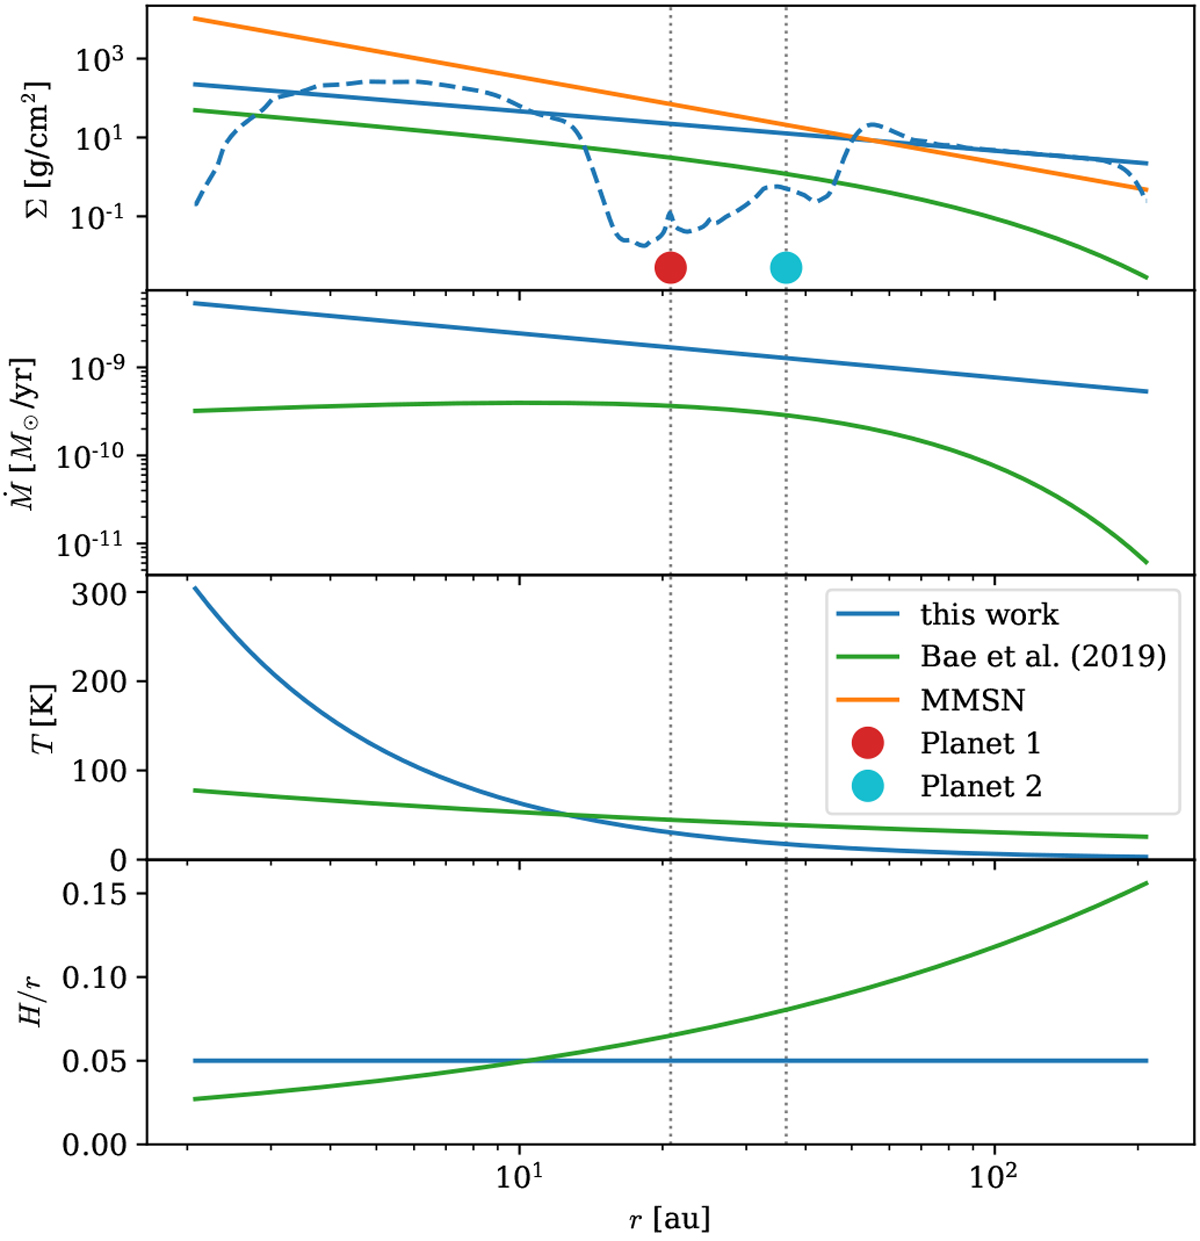
Initial conditions for the disc around the 1 M⊙ star used in our simulations (blue). These are compared to the initial conditions of the disc in Bae et al. (2019) (green) in which the PDS70 system (0.85 M⊙ star) was modelled. For context, the surface density of the minimum mass solar nebula (MMSN; Hayashi 1981) is plotted in orange. Physical initial conditions after the equilibration phase (see Fig. 2) at t = 26 kyr are shown for model M9-3 as a dashed blue line. The panels, from top to bottom, show the radial profile of the: surface density, viscous mass accretion rate (Ṁdisc = 3πΣν with α = 10−3), temperature, and aspect ratio. The initial location of the planets are marked by the vertical, dotted lines which span over all panels and are indicated by the red and cyan circles.
Current usage metrics show cumulative count of Article Views (full-text article views including HTML views, PDF and ePub downloads, according to the available data) and Abstracts Views on Vision4Press platform.
Data correspond to usage on the plateform after 2015. The current usage metrics is available 48-96 hours after online publication and is updated daily on week days.
Initial download of the metrics may take a while.