Fig. 8.
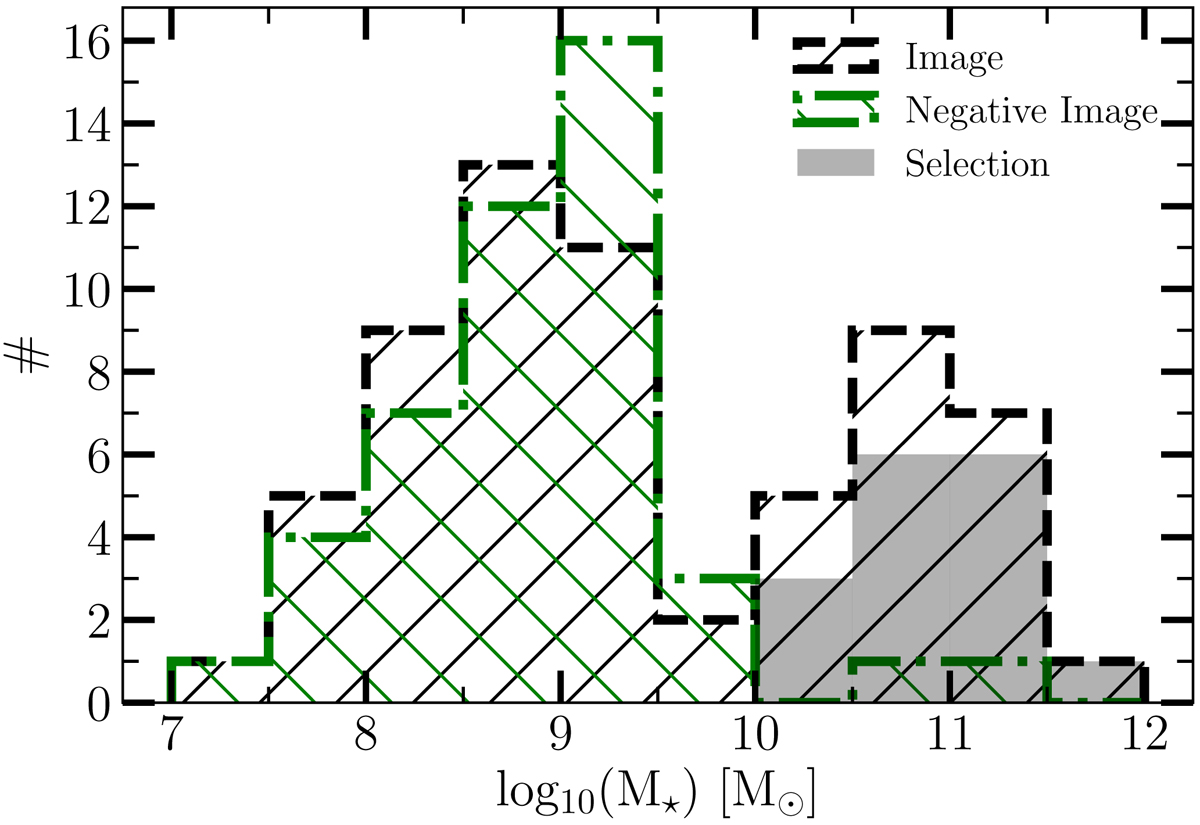
Stellar mass distribution resulting from the cross-matched between the ZFOURGE catalog and the detection at 3.5σ in the image (dashed black line) and in the negative image (dashed-dotted green lines). The selection work presented in this study allowed us to select 16 galaxies (in gray) all located in the second peak of the stellar mass distribution (absent in the negative image).
Current usage metrics show cumulative count of Article Views (full-text article views including HTML views, PDF and ePub downloads, according to the available data) and Abstracts Views on Vision4Press platform.
Data correspond to usage on the plateform after 2015. The current usage metrics is available 48-96 hours after online publication and is updated daily on week days.
Initial download of the metrics may take a while.