Fig. 7.
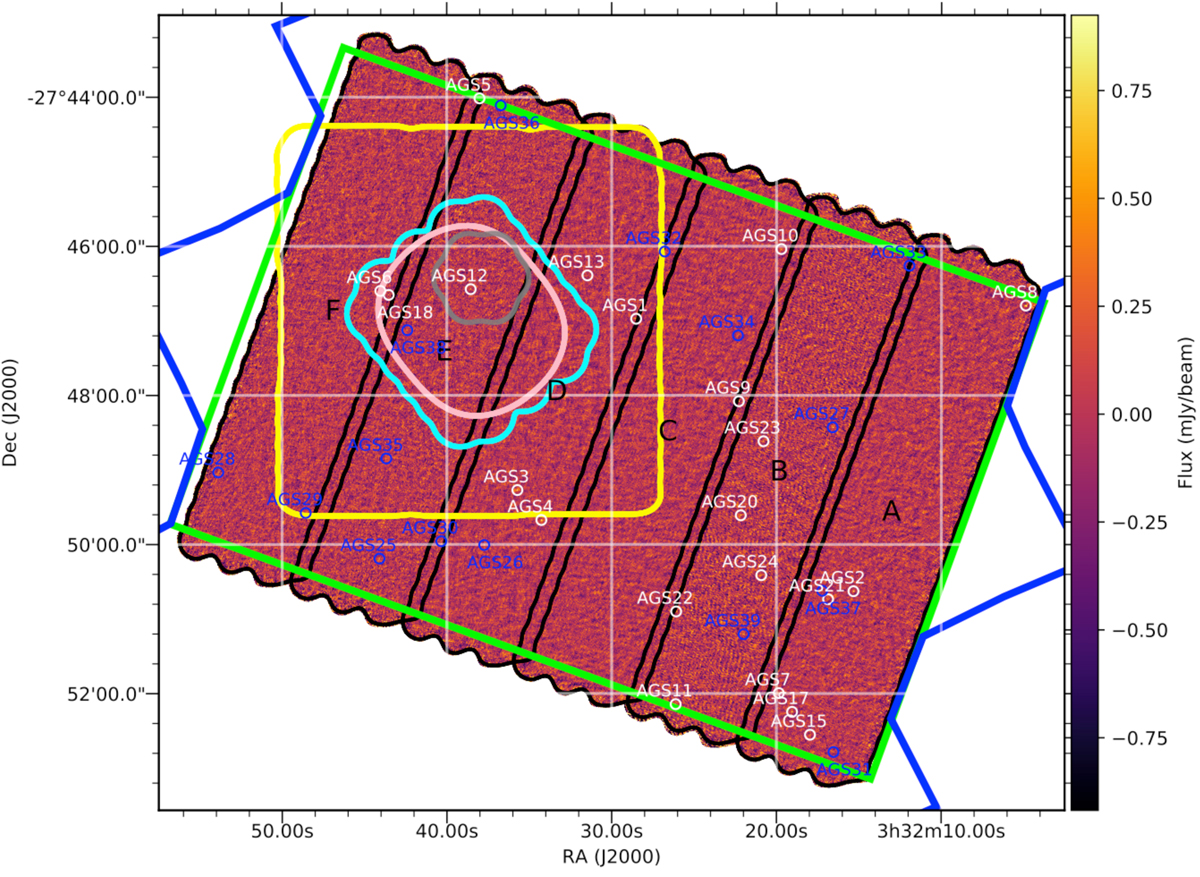
ALMA 1.1 mm image tapered at 0![]() 60. The white circles have a diameter of 4 arcsec and indicate the positions of the galaxies listed in Table 1. Black contours show the different slices (labeled A to F) used to construct the homogeneous 1.1 mm coverage, with a median rms = 0.18 mJy beam−1. Blue lines show the limits of the HST/ACS field and green lines indicate the HST-WFC3 deep region. The cyan contours represent the limit of the Dunlop et al. (2017) survey covering all of the Hubble Ultra Deep Field region, the yellow contours show the ASAGAO survey (Hatsukade et al. 2018), while the gray contours show the ASPECS Pilot survey (Walter et al. 2016), the pink contours show the ASPECS Large Program (Decarli et al. 2019).
60. The white circles have a diameter of 4 arcsec and indicate the positions of the galaxies listed in Table 1. Black contours show the different slices (labeled A to F) used to construct the homogeneous 1.1 mm coverage, with a median rms = 0.18 mJy beam−1. Blue lines show the limits of the HST/ACS field and green lines indicate the HST-WFC3 deep region. The cyan contours represent the limit of the Dunlop et al. (2017) survey covering all of the Hubble Ultra Deep Field region, the yellow contours show the ASAGAO survey (Hatsukade et al. 2018), while the gray contours show the ASPECS Pilot survey (Walter et al. 2016), the pink contours show the ASPECS Large Program (Decarli et al. 2019).
Current usage metrics show cumulative count of Article Views (full-text article views including HTML views, PDF and ePub downloads, according to the available data) and Abstracts Views on Vision4Press platform.
Data correspond to usage on the plateform after 2015. The current usage metrics is available 48-96 hours after online publication and is updated daily on week days.
Initial download of the metrics may take a while.