Fig. 4.
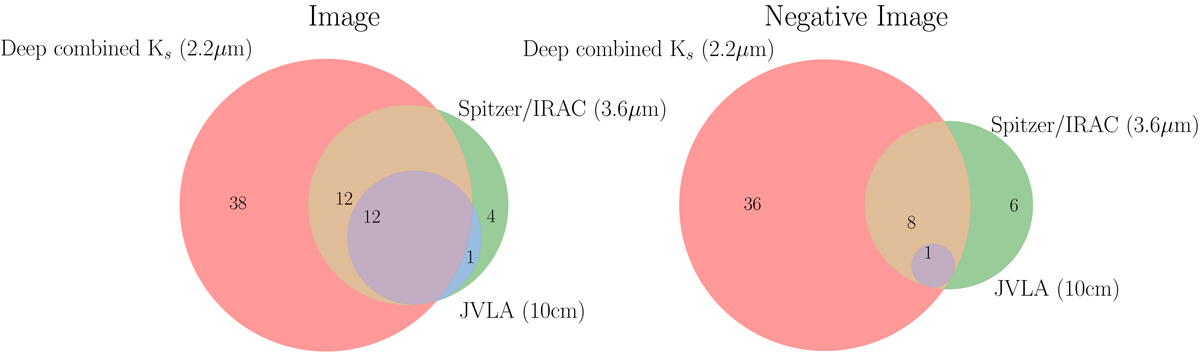
Number of sources cross-matched between the ALMA 3.5σ detection and the ZFOURGE (Straatman et al. 2016), S-CANDELS (Ashby et al. 2015) and GOODS-VLA (PI: W.Rujopakarn, priv. comm.) catalogs in the image (left panel) and in the negative image (right panel), within a radius of 0![]() 60 for the ZFOURGE and the VLA catalogs and 0
60 for the ZFOURGE and the VLA catalogs and 0![]() 70 for the S-CANDELS catalog. Beforehand, we previously removed from the image the sources that had been detected in F18. For example, in the “direct” image, among the 29 source detected both with ALMA at 3.5σ and in the Spitzer/IRAC channel 1 image, 24 are also detected in the ultra-deep Ks image, and 13 are detected with the VLA.
70 for the S-CANDELS catalog. Beforehand, we previously removed from the image the sources that had been detected in F18. For example, in the “direct” image, among the 29 source detected both with ALMA at 3.5σ and in the Spitzer/IRAC channel 1 image, 24 are also detected in the ultra-deep Ks image, and 13 are detected with the VLA.
Current usage metrics show cumulative count of Article Views (full-text article views including HTML views, PDF and ePub downloads, according to the available data) and Abstracts Views on Vision4Press platform.
Data correspond to usage on the plateform after 2015. The current usage metrics is available 48-96 hours after online publication and is updated daily on week days.
Initial download of the metrics may take a while.