Open Access
Fig. 2.
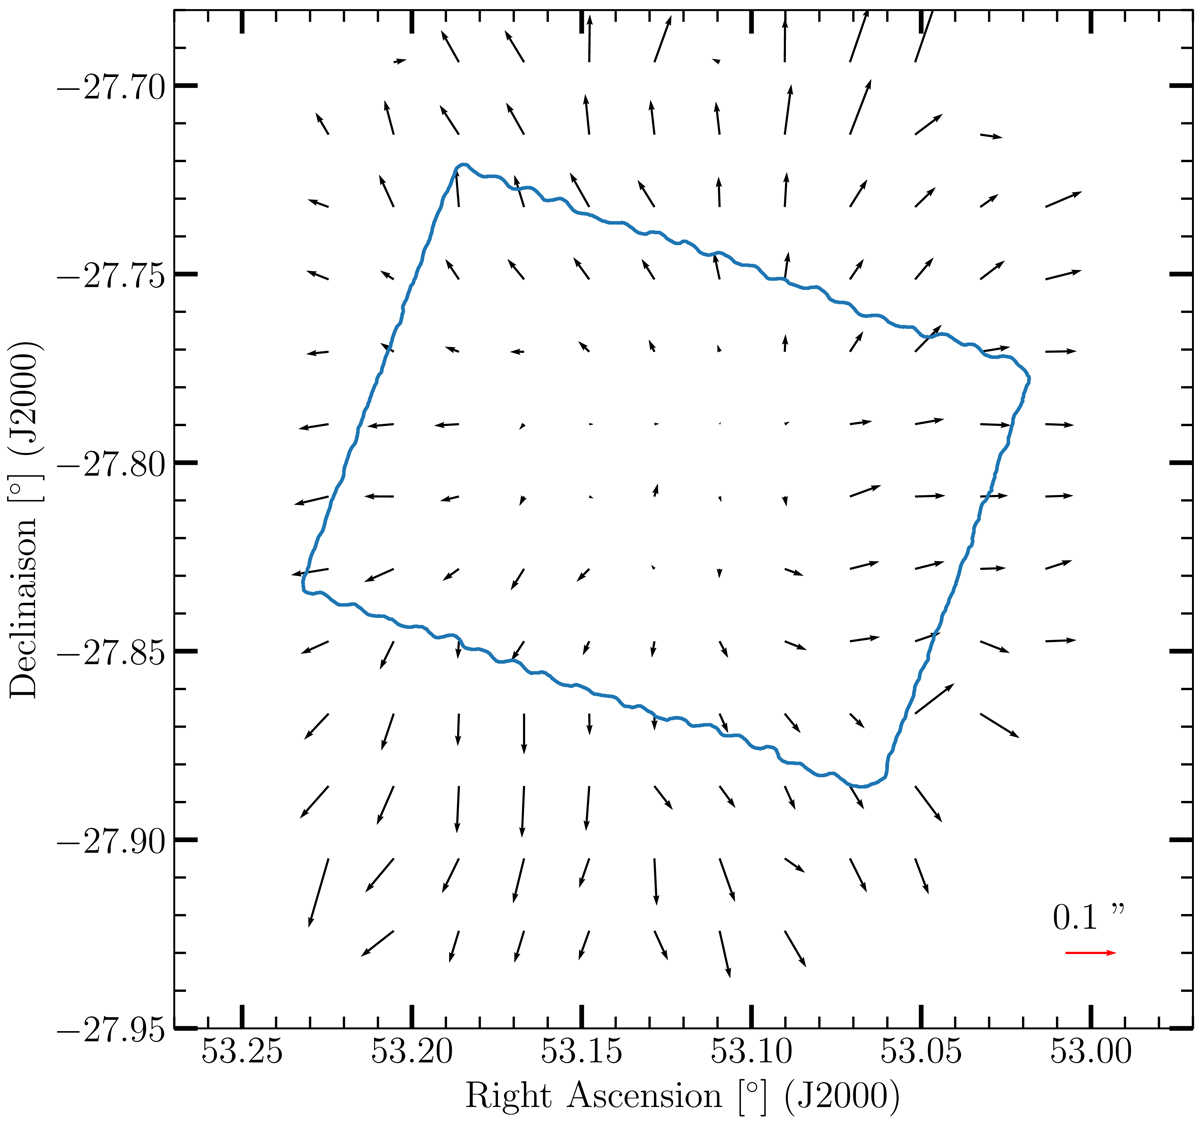
Difference between the HST and Pan-STARRS position after subtraction of the median offset value. Each arrow represents a sliding median including on average 15 galaxies, with an overlap of 60% between neighboring arrows. The blue line defines the area encompassing the GOODS-ALMA survey.
Current usage metrics show cumulative count of Article Views (full-text article views including HTML views, PDF and ePub downloads, according to the available data) and Abstracts Views on Vision4Press platform.
Data correspond to usage on the plateform after 2015. The current usage metrics is available 48-96 hours after online publication and is updated daily on week days.
Initial download of the metrics may take a while.