Fig. 13.
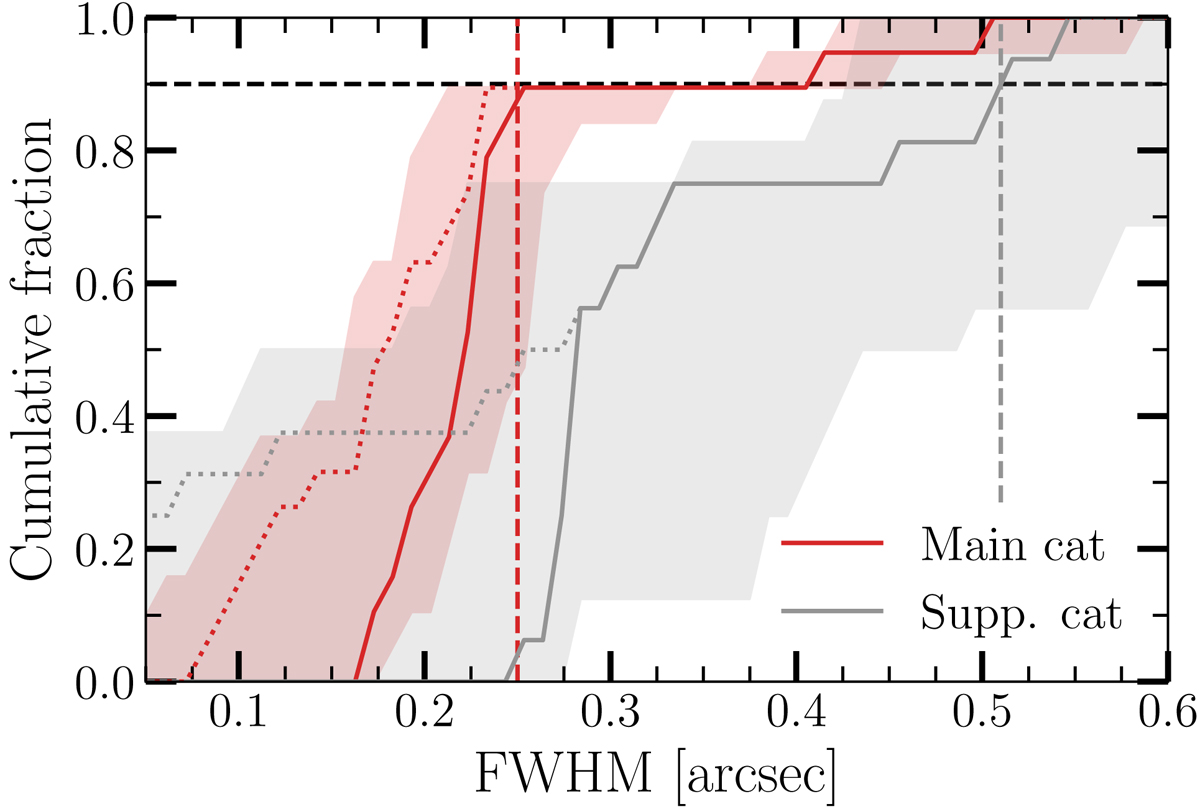
Cumulative fraction of sources with a FWHM below a given size for the main (red) and the supplementary catalog (gray). These sizes are computed by fitting the ALMA detections with a circular Gaussian in the uv-plane using uvmodelfit in CASA. The dotted lines refer to the sizes given by uvmodelfit, while the solid lines take into account take into account the upper limits given by Eq. (2). The shaded areas correspond to the integration of the individual uncertainties of the sizes of each detection.
Current usage metrics show cumulative count of Article Views (full-text article views including HTML views, PDF and ePub downloads, according to the available data) and Abstracts Views on Vision4Press platform.
Data correspond to usage on the plateform after 2015. The current usage metrics is available 48-96 hours after online publication and is updated daily on week days.
Initial download of the metrics may take a while.