Fig. 12.
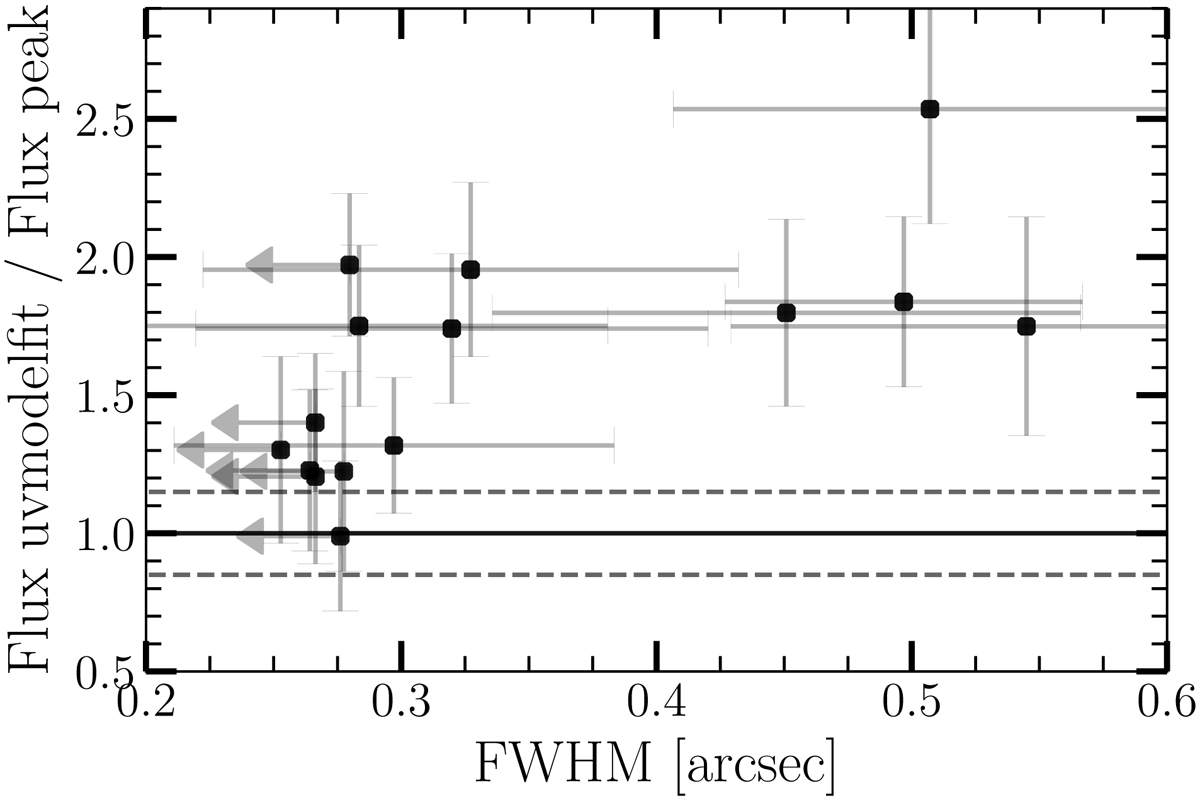
Ratio between the flux extracted using uvmodelfit in CASA and the peak flux as a function of the size of the galaxy for the supplementary catalog. When the measured size is below the reliable size measurement limit (see Eq. (2)), we consider the size given by Eq. (2) as an upper limit (see Table 4). The horizontal solid line indicates flux uvmodelfit = peak flux. The dotted lines show a 15% deviation from this equality. For galaxies larger than 0![]() 25, the approximation of a point source is no longer valid, and we assume the flux value derived from uvmodelfit for these galaxies.
25, the approximation of a point source is no longer valid, and we assume the flux value derived from uvmodelfit for these galaxies.
Current usage metrics show cumulative count of Article Views (full-text article views including HTML views, PDF and ePub downloads, according to the available data) and Abstracts Views on Vision4Press platform.
Data correspond to usage on the plateform after 2015. The current usage metrics is available 48-96 hours after online publication and is updated daily on week days.
Initial download of the metrics may take a while.