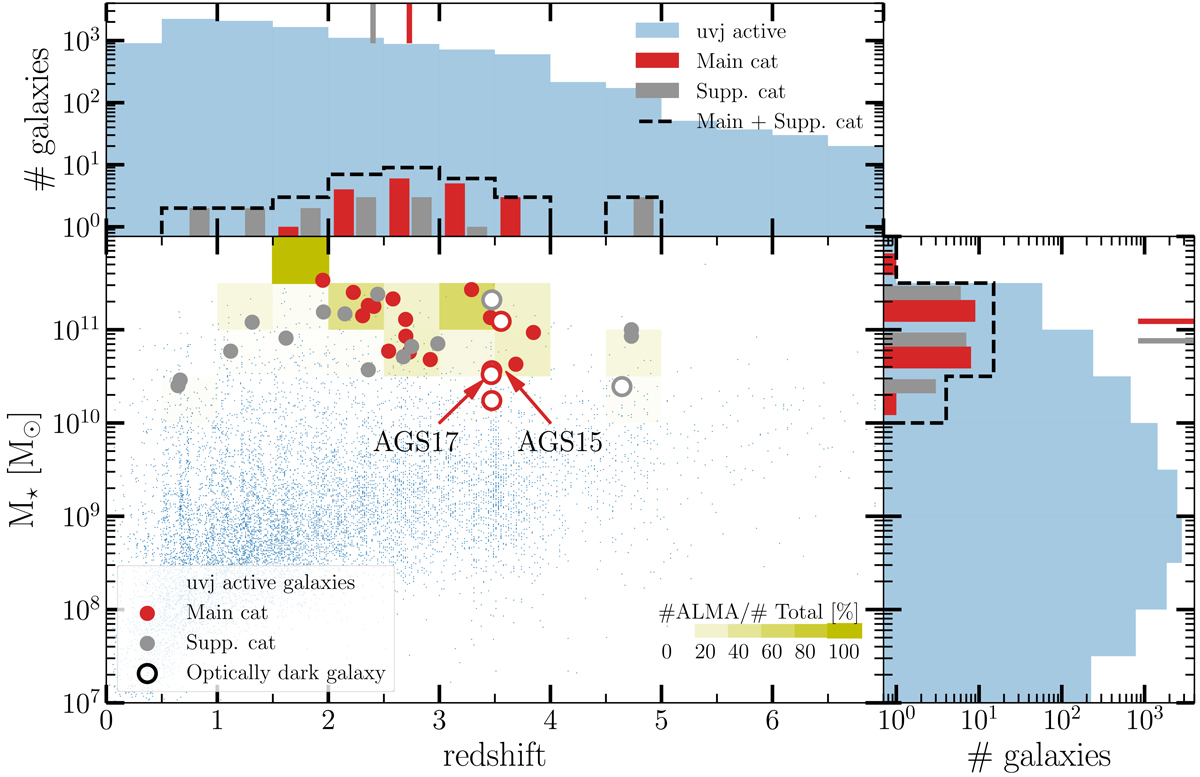
Fig. 10.

Stellar mass as a function of redshift for the galaxies detected in F18 (red points) and in this work (gray points). For comparison, the distribution of all the galaxies, listed in the ZFOURGE catalog, in the same field of view is given in blue. Only UVJ active galaxies are shown. For each bin of redshift (Δz = 0.5) and stellar mass (log10(M⋆/M⊙) = 0.5), the fraction of sources detected by ALMA compared to the UVJ active galaxies in GOODS-ALMA is indicated with a yellow shading. The optically dark galaxies for which redshifts and masses have been derived are represented by open circles. Upper panel: compared distribution of redshift between all the UVJ active galaxies in GOODS-ALMA and the ALMA-detected galaxies; right panel: stellar mass distribution. The median redshift and stellar mass are shown in these two panels. The median redshift is 2.40 for the galaxies presented in this paper, compared to 2.73 in F18, while the median stellar mass is 7.6 × 10¹⁰ M⊙ in this study, compared to 1.2 × 10¹¹ M⊙ in F18.
Current usage metrics show cumulative count of Article Views (full-text article views including HTML views, PDF and ePub downloads, according to the available data) and Abstracts Views on Vision4Press platform.
Data correspond to usage on the plateform after 2015. The current usage metrics is available 48-96 hours after online publication and is updated daily on week days.
Initial download of the metrics may take a while.


