Fig. 4
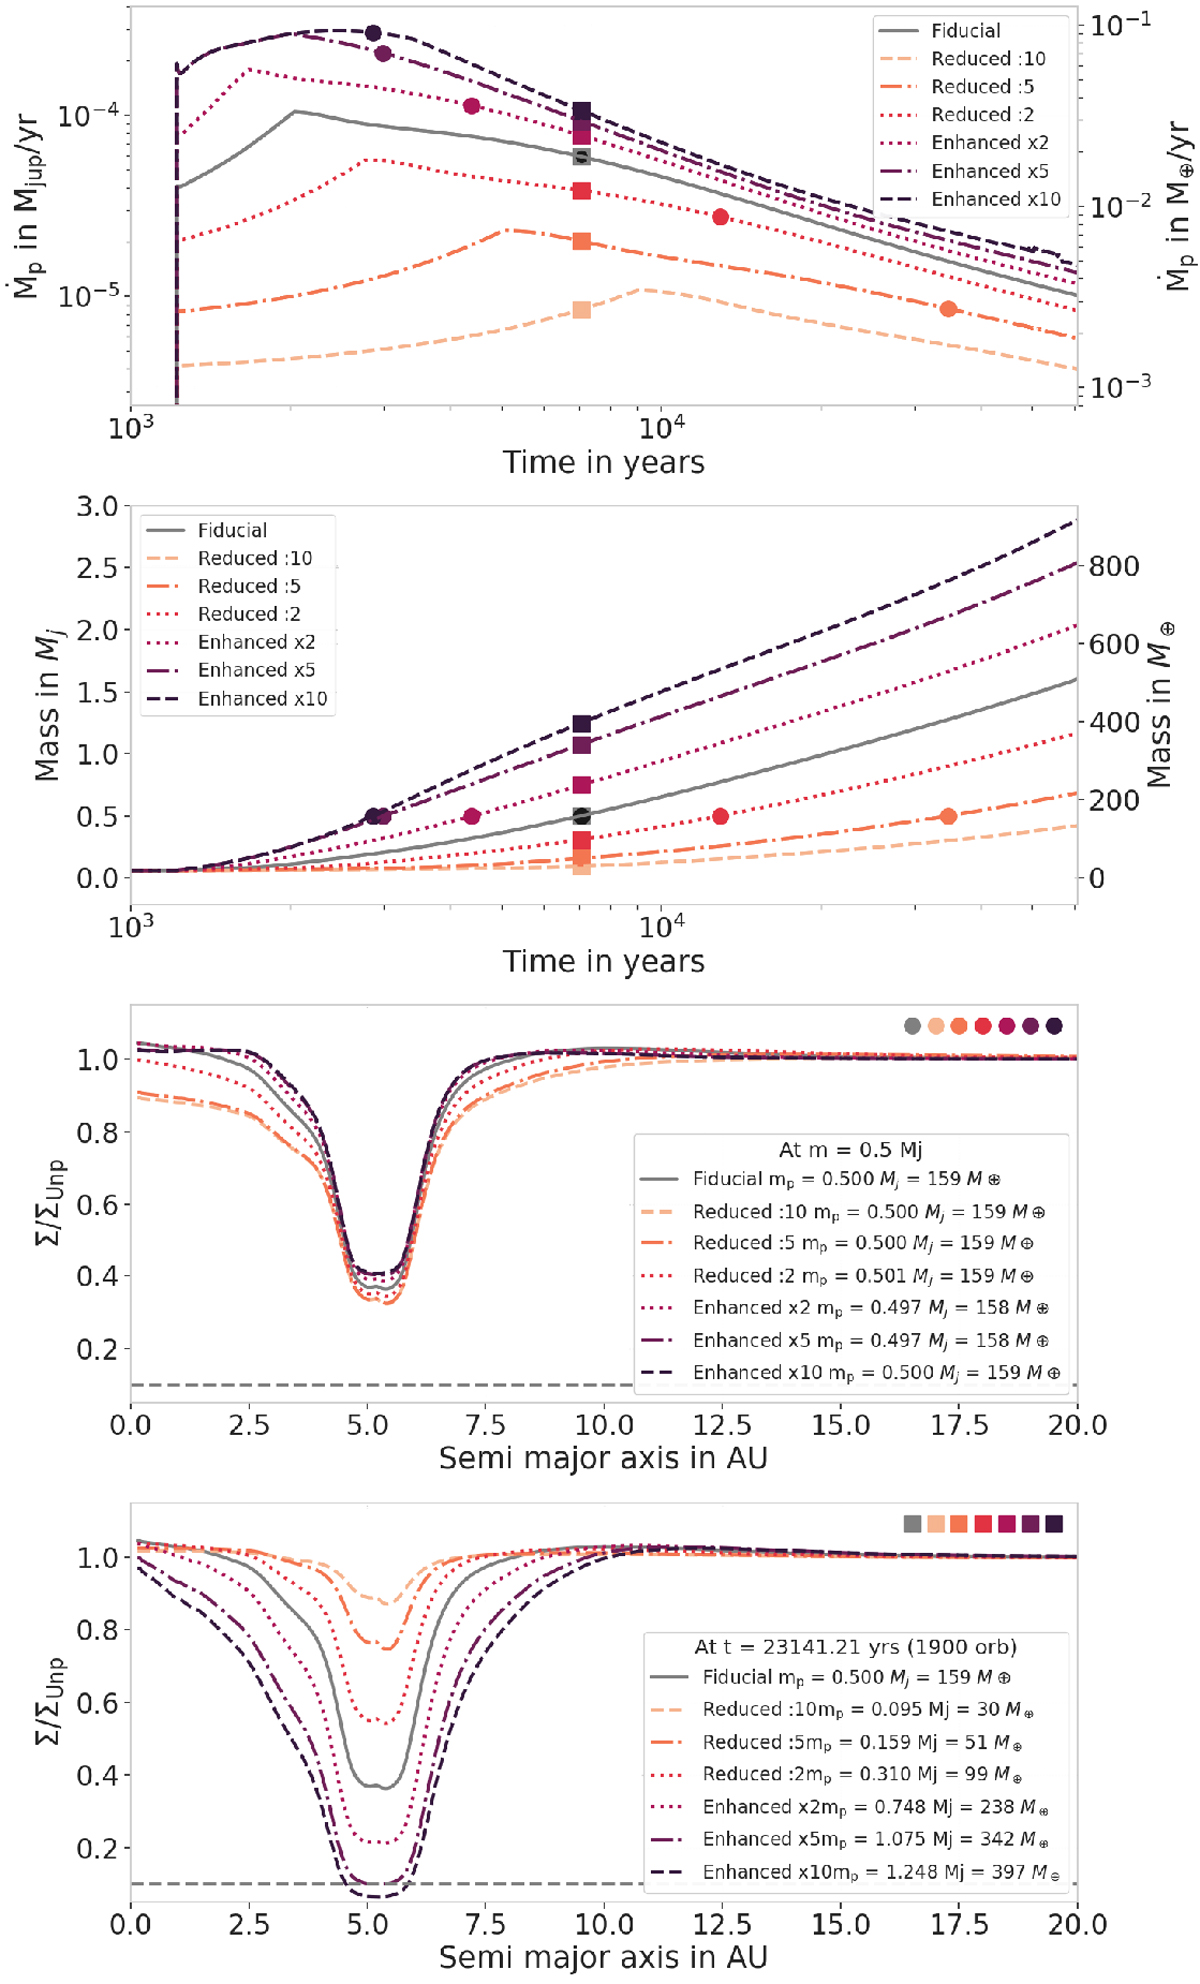
Influence of different accretion rates. Top: time evolution of the different accretion rates. The fiducial setup is represented in solid gray line. The dashed, dotted, and dotted-dashed lines represent the different accretion rates applied here, where the Machida part was divided and multiplied by 10, 5, and 2. The enhanced by 10 and 5 simulations show a similar rate at the beginning of the simulation as they are limited to the maximum accretion the disc can provide. Middle 1: time evolution of the planetary mass in the seven different accretion regimes. The dots represent the time at which the mass is 0.5 MJ and the squares represent the different masses at the same time. Middle 2: perturbed surface density at the time where m = 0.5 MJ (dots in previous panels). The surface density is normalized to a disc without a planet. Bottom: perturbed surface density at the same time t = 580 orbits (squares in previous panels). The horizontal gray dashed line marks the gap-opening criterion as defined by Crida et al. (2006), Σ∕Σunp = 0.1.
Current usage metrics show cumulative count of Article Views (full-text article views including HTML views, PDF and ePub downloads, according to the available data) and Abstracts Views on Vision4Press platform.
Data correspond to usage on the plateform after 2015. The current usage metrics is available 48-96 hours after online publication and is updated daily on week days.
Initial download of the metrics may take a while.