Fig. 18
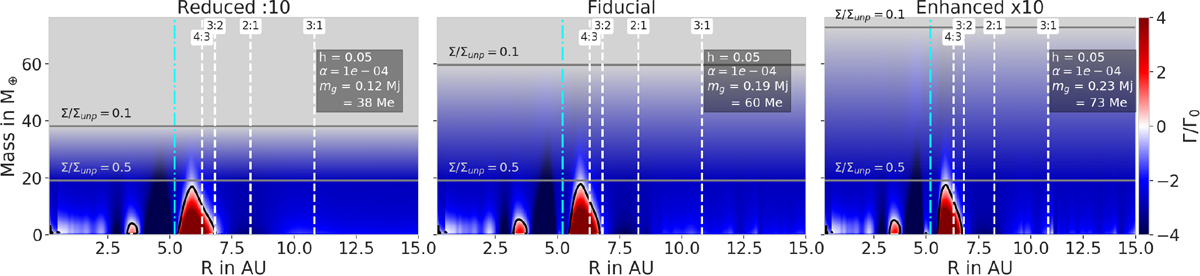
Migration maps for α = 10−4 and h = 0.05 for low-mass planets orbiting near our accreting planets. The accreting planet has reached the gap-opening mass. The three panelsrepresent different accretion rates: the reduced by 10 (left), fiducial (middle), and enhanced by 10 (right). The plotted information is the same as in Fig. 16. As gas accretion has an influence on the gap-opening mass, the migration maps look different due to the switch from type I to type II migration when a gap is opened. Here, the Σ∕Σunp = 0.5 is at the same mass for all the different accretion rates as the initial depth for these discs parameters is smaller than 0.5 (see Table 2).
Current usage metrics show cumulative count of Article Views (full-text article views including HTML views, PDF and ePub downloads, according to the available data) and Abstracts Views on Vision4Press platform.
Data correspond to usage on the plateform after 2015. The current usage metrics is available 48-96 hours after online publication and is updated daily on week days.
Initial download of the metrics may take a while.