Fig. 16
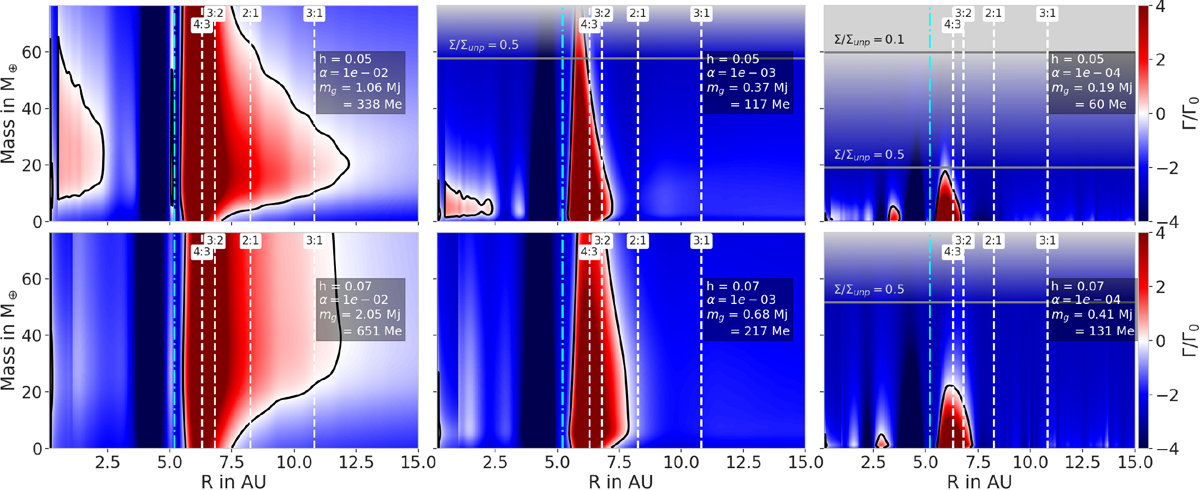
Migration maps for low-mass planets orbiting near our accreting planets. The accreting planet has reached gap-opening mass. The different panels represent different disc parameters: the viscosity decreases from left to right (α = 10−2, 10−3, 10−4) and the aspect ratio increases from top to bottom (h = 0.05, 0.07). Positive (red) torques indicate outward migration while negative (blue) torques represent inward migration.The black solid line represents the zero torque line, a position where the second planet would stop migrating. The two gray horizontal lines represent the masses at which Σ∕Σunp = 0.5 and 0.1. We consider that the planet will smoothly switch from type I to type II migration between these two masses. The vertical white dashed lines locate the positions of the resonances with the accreting planet situated at 5.2 AU (vertical blue dotted dashed line).
Current usage metrics show cumulative count of Article Views (full-text article views including HTML views, PDF and ePub downloads, according to the available data) and Abstracts Views on Vision4Press platform.
Data correspond to usage on the plateform after 2015. The current usage metrics is available 48-96 hours after online publication and is updated daily on week days.
Initial download of the metrics may take a while.