Fig. 12
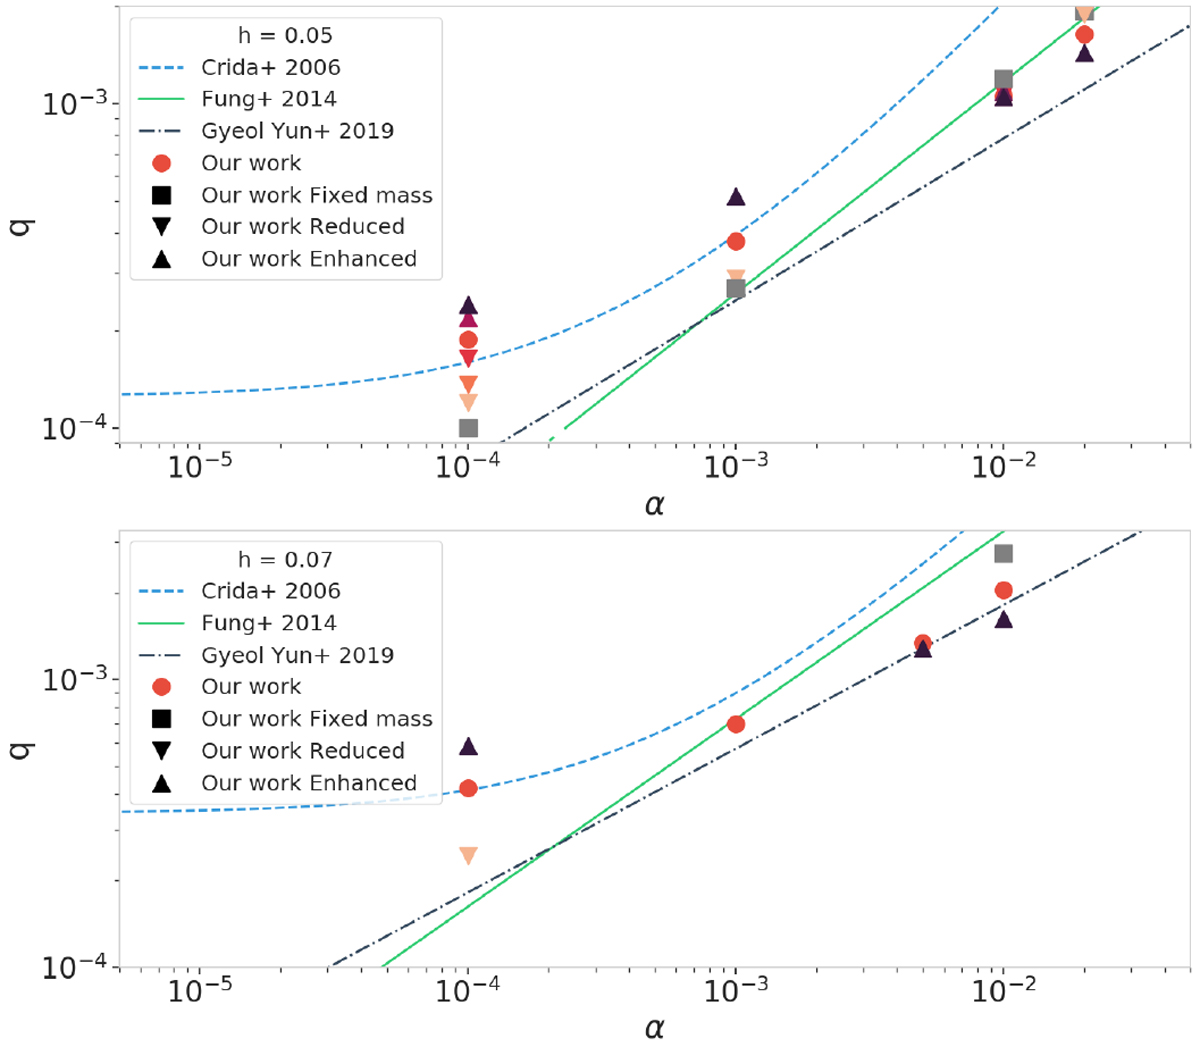
Gap-opening mass as a function of the viscosity for different criteria and our simulations. The lines represent the different gap-opening criteria from the literature: Fung et al. (2014) in solid green, Crida et al. (2006) in dashed blue, and Gyeol Yun et al. (2019) in dashed-dotted black. The dotted green line represents the mass limit of the Fung et al. (2014) study. None of these works include planetary gas accretion. Red dots represent our fiducial simulations.Results from the different accretion rates are represented by upward triangles for the enhanced accretion rates and downward triangles for the reduced accretion rates. The color coding is the same as in Fig. 4: darker colors represent larger accretion rates. The two different panels are for the two high aspect ratios: h = 0.05 (top) and 0.07 (bottom). The initial mass of the planet is 20 M⊕. Gas accretion has different impact as a function of disc parameters. This discrepancy can be explained by the time needed to the disc to react to a change of planetary mass.
Current usage metrics show cumulative count of Article Views (full-text article views including HTML views, PDF and ePub downloads, according to the available data) and Abstracts Views on Vision4Press platform.
Data correspond to usage on the plateform after 2015. The current usage metrics is available 48-96 hours after online publication and is updated daily on week days.
Initial download of the metrics may take a while.