Fig. 9
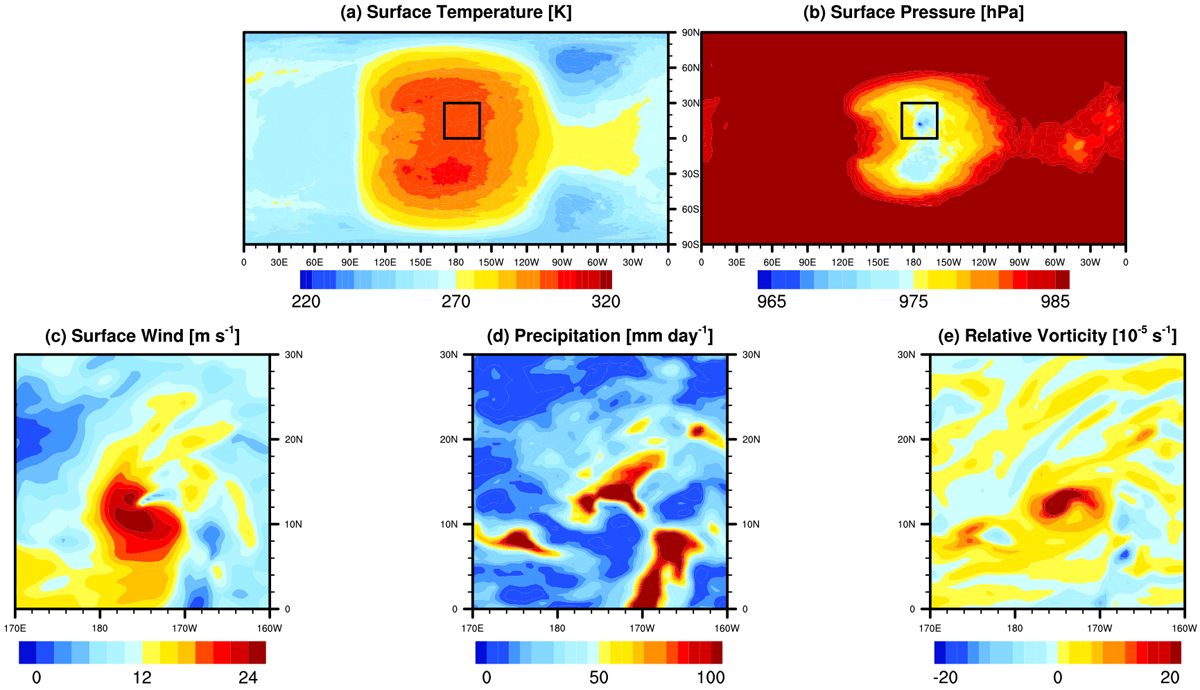
Snapshots of (a) surface temperature, (b) surface air pressure, (c) near-surface wind strength, (d) precipitation, and (e) relative vorticity in one experiment coupled to a slab ocean. Panels c–e: only the hurricane region is shown in order to more clearly exhibit the structure of the hurricane. In this experiment, rotation period (=orbital period) is ten Earth days, the CO2 concentration is 300 ppmv, stellar flux is 1450 W m−2, and the startemperature is 2600 K. No oceanic heat transport is involved in this run.
Current usage metrics show cumulative count of Article Views (full-text article views including HTML views, PDF and ePub downloads, according to the available data) and Abstracts Views on Vision4Press platform.
Data correspond to usage on the plateform after 2015. The current usage metrics is available 48-96 hours after online publication and is updated daily on week days.
Initial download of the metrics may take a while.