Fig. 5
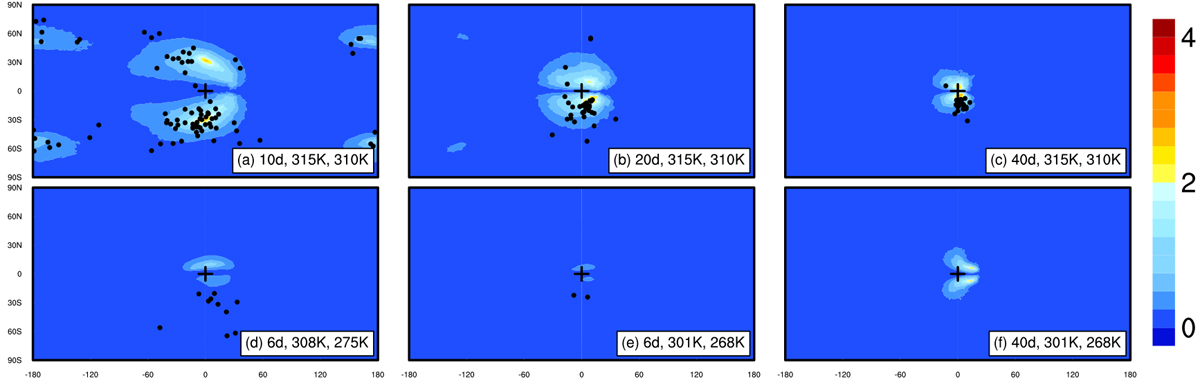
Effects of planetary rotation and surface temperature on hurricane formation (dots) and the GPI (color shading). Experiments are for varying rotation period (a–c), varying surface temperature (d,e), and varying values of both (f). Experimental designs are the same as the control experiment in Fig. 1 except that the rotation period is set to (a)10, (b) 20, and (c) 40 Earth days; (d) maximum surface temperature reduced from 315 to 308 K and the night-side surface temperature is reduced from 310 to 275 K (see Fig. 6a). (e) Same as (d) but for 301 K and 268 K, respectively (see Fig. 6b); and (f) same as (e) but for a rotation period of 40 earth days. The number of hurricanes is 88, 34, 21, 10, 2, and 0, respectively. See Fig. 7 for snapshots of typical hurricanes. The southern hemisphere always has more hurricanes than the northern hemisphere; this may be due to some asymmetry in initial state or some stochastic process in the model.
Current usage metrics show cumulative count of Article Views (full-text article views including HTML views, PDF and ePub downloads, according to the available data) and Abstracts Views on Vision4Press platform.
Data correspond to usage on the plateform after 2015. The current usage metrics is available 48-96 hours after online publication and is updated daily on week days.
Initial download of the metrics may take a while.