Fig. 3
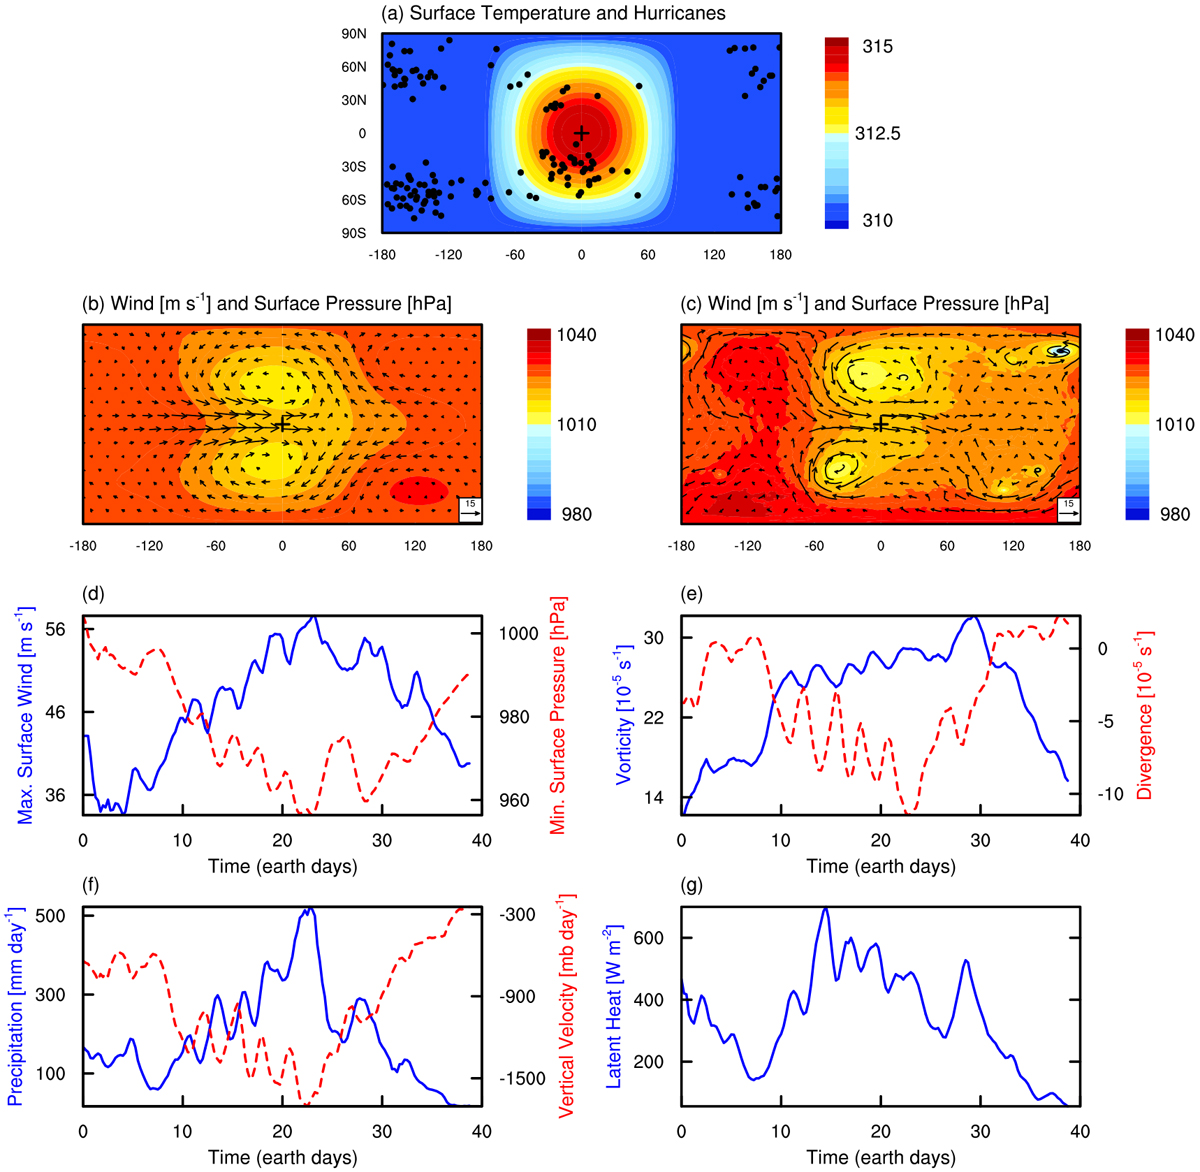
Mechanisms for hurricane formation in the control experiment. (a) Location of hurricane formation (dots) and surface air temperature (color shading). The number of hurricanes during the four-year integration is 154. (b) Long-term mean surface air pressure (shading) and winds at 850 hPa (vector). (c) Same as (b) but for an instantaneous. The life cycle of one hurricane on the day side: (d) maximum surface wind speed (blue) and minimum surface pressure (red). (e) Relative vorticity (blue) and divergence (red) at 850 hPa. (f) Precipitation (blue) and vertical velocity at 850 hPa (red), and (g) surface latent heat flux (blue). (e)–(g) Variables are calculated for area mean of 500 × 500 km2 around the low-pressure center.
Current usage metrics show cumulative count of Article Views (full-text article views including HTML views, PDF and ePub downloads, according to the available data) and Abstracts Views on Vision4Press platform.
Data correspond to usage on the plateform after 2015. The current usage metrics is available 48-96 hours after online publication and is updated daily on week days.
Initial download of the metrics may take a while.