Fig. 9
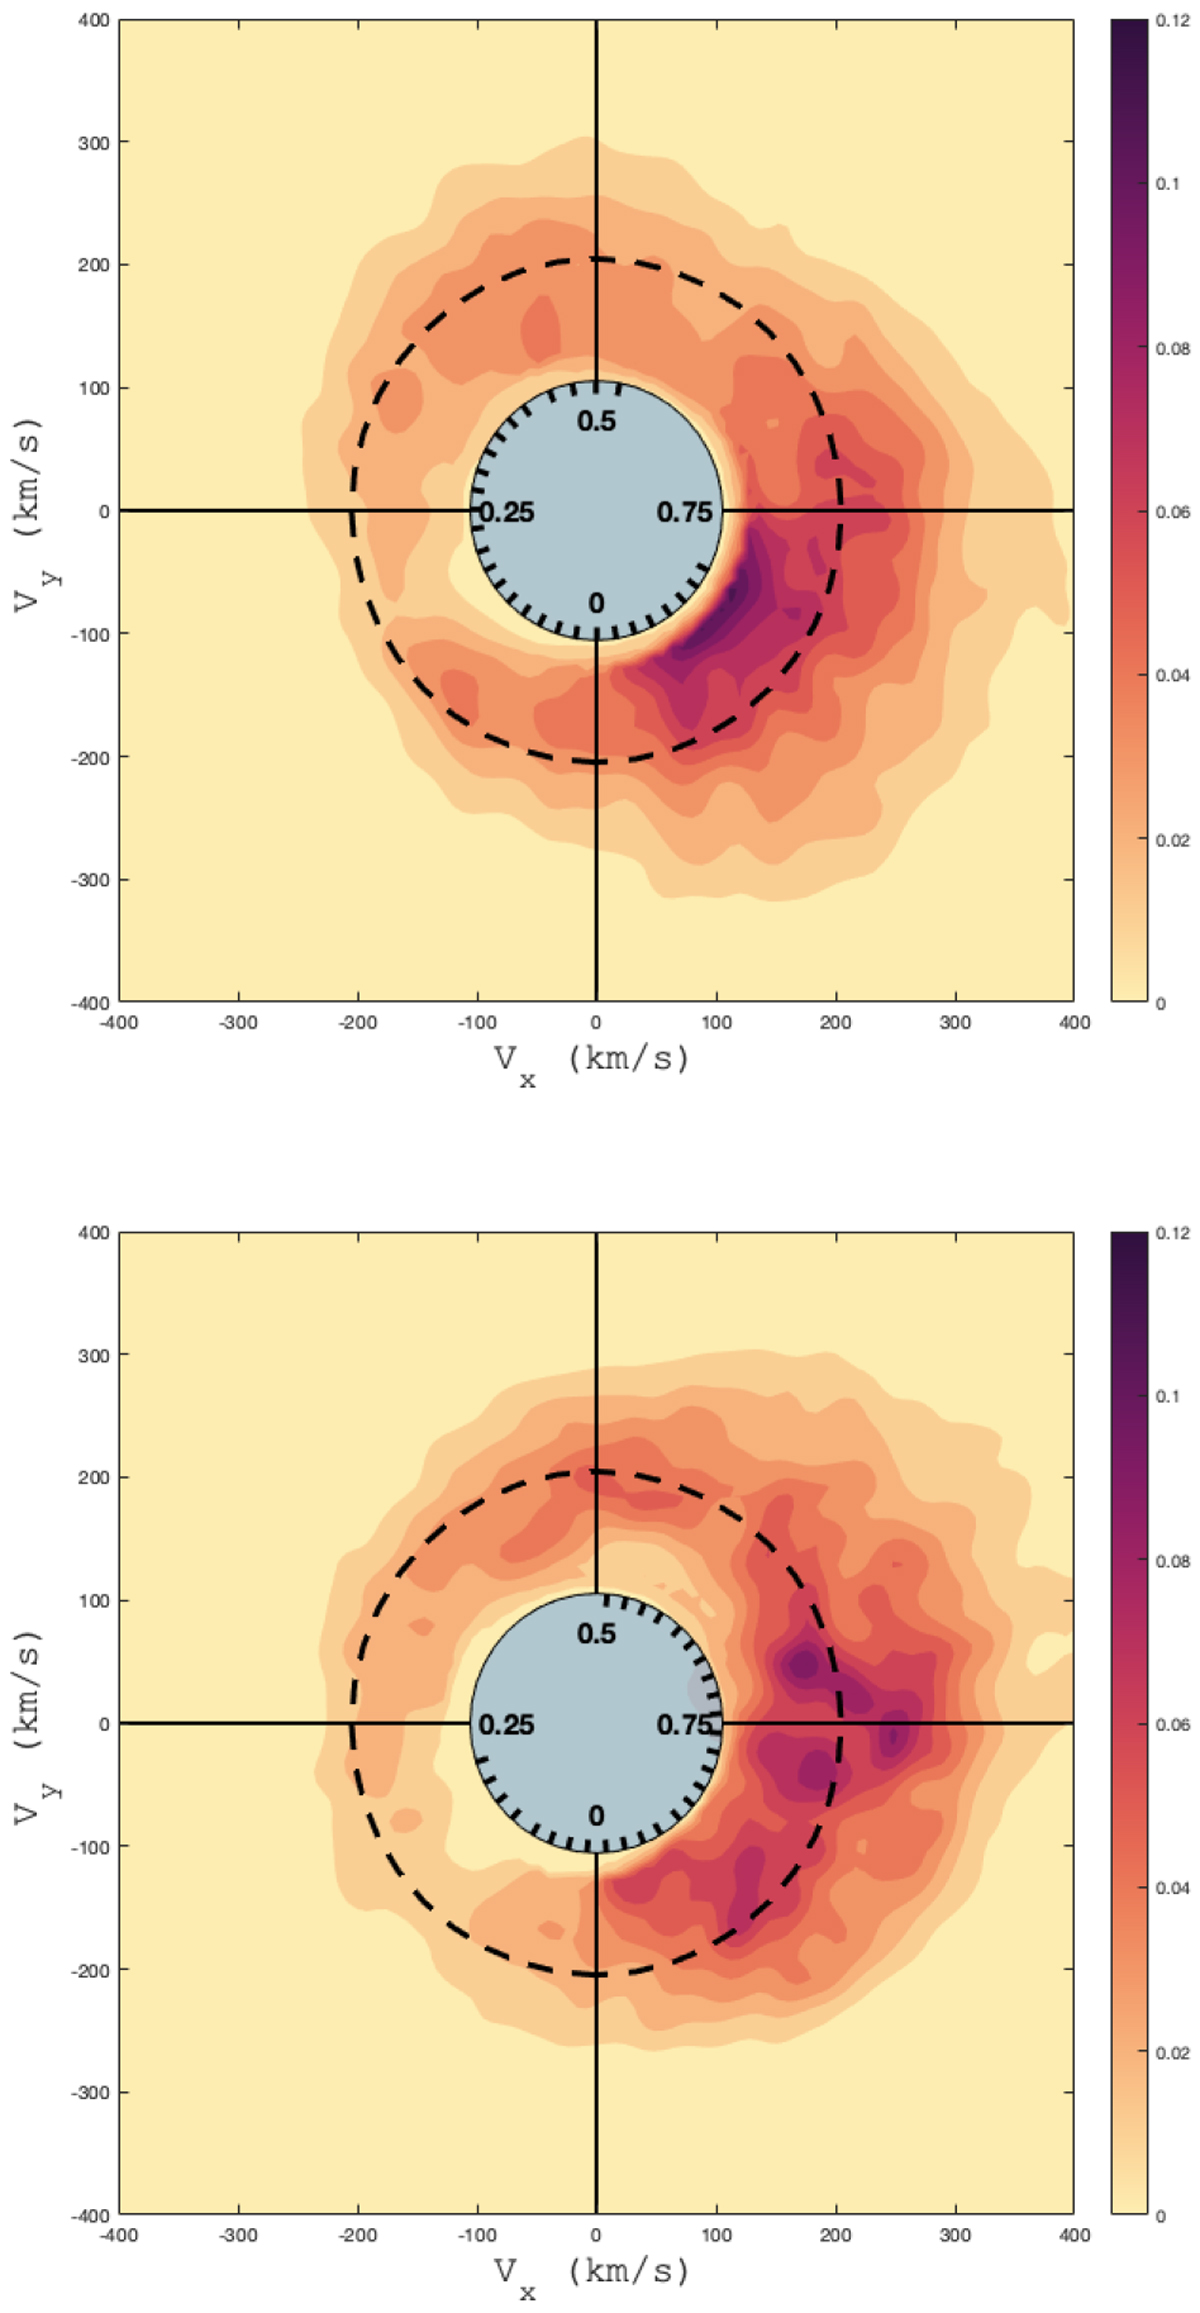
Prominence maps of V530 Per reconstructed from the data of 29 Nov., 2006 (top) and 05 Dec., 2006 (bottom). The inner, filled blue circle represents the stellar surface. Radial ticks inside this circle give the rotational phases of our observations. The outer dashed circle is the corotation radius. The color scale depicts the local Hα equivalent width, in units of picometers per 8 km s−1 square pixel.
Current usage metrics show cumulative count of Article Views (full-text article views including HTML views, PDF and ePub downloads, according to the available data) and Abstracts Views on Vision4Press platform.
Data correspond to usage on the plateform after 2015. The current usage metrics is available 48-96 hours after online publication and is updated daily on week days.
Initial download of the metrics may take a while.