Fig. 8
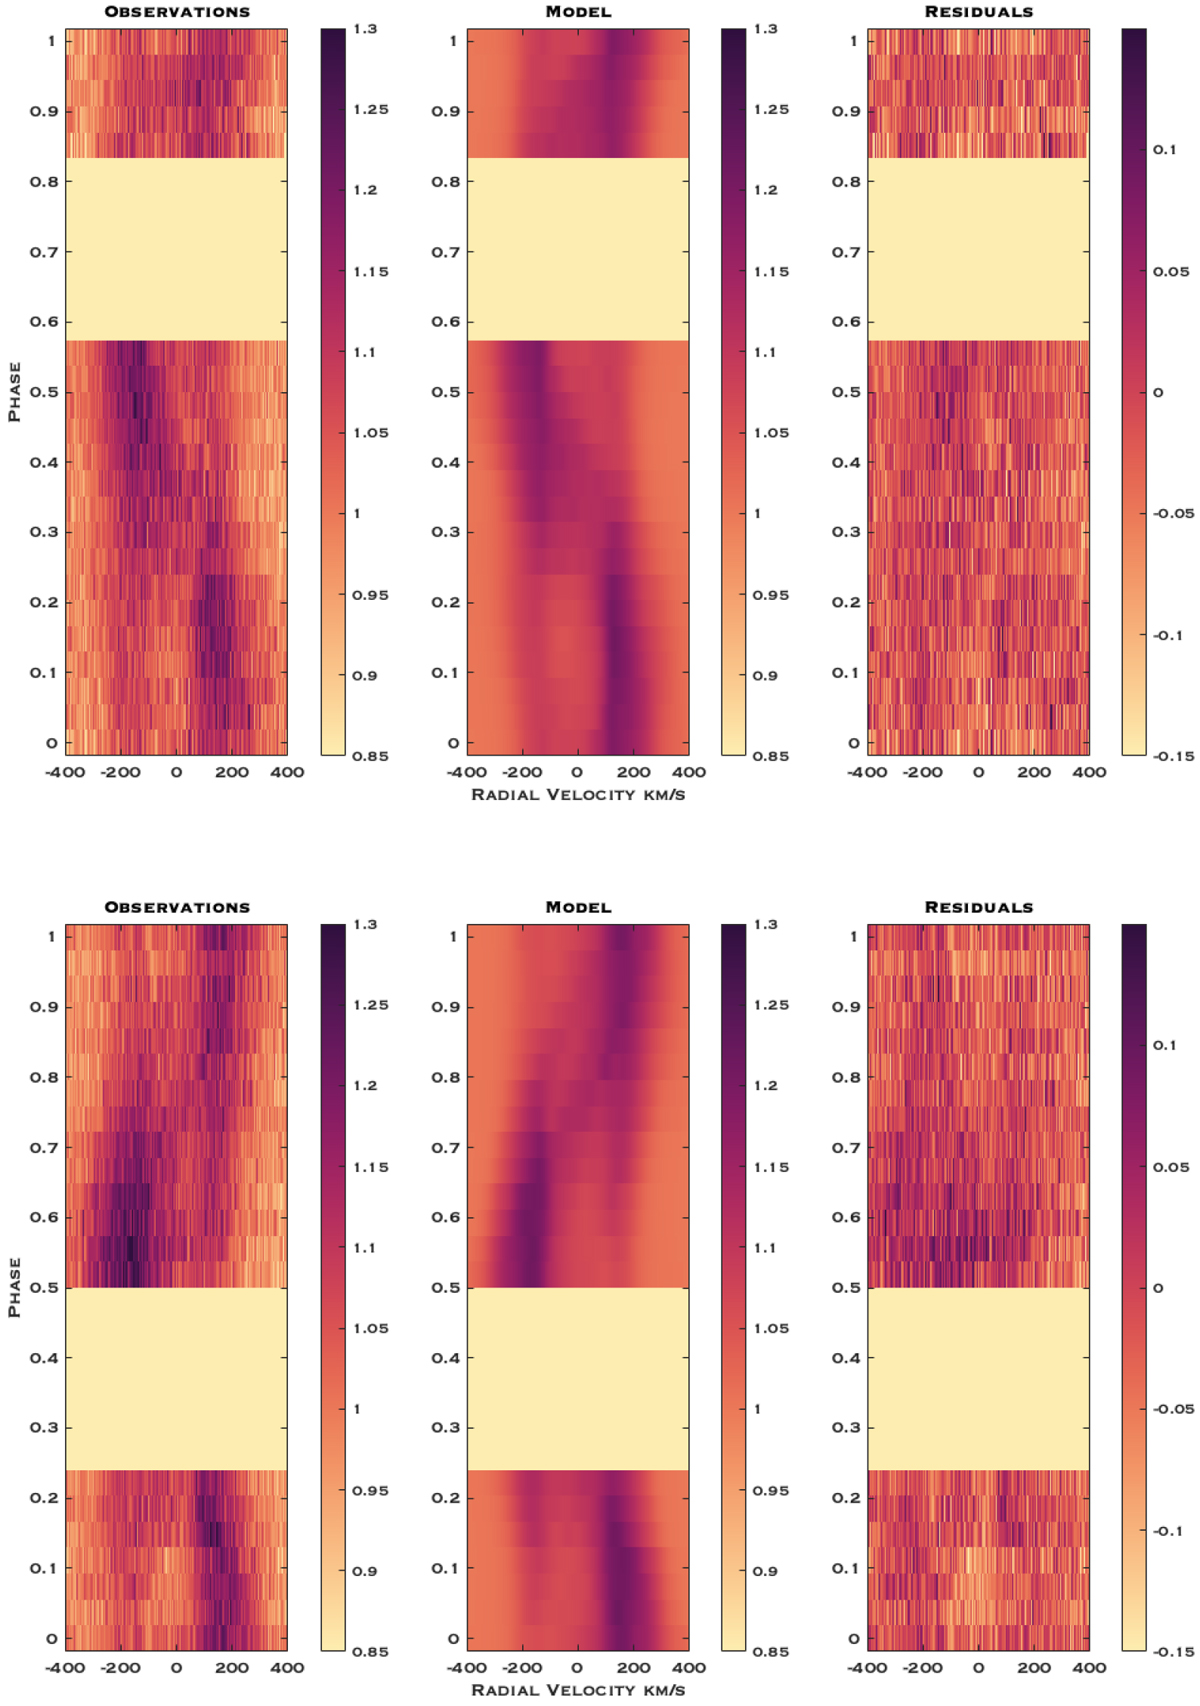
Dynamic spectra showing the Hα line of V530 Per, color coded according to the normalized flux. Rotational phases are computed according to Eq. (1). Upper and lower panels: 29 Nov. and 05 Dec., respectively. From left to right: we display the observations, the outcome of the tomographic model, and the residuals. Hα mapping from the first night leads to a reduced χ2 of 7.2, while the second night provides us with a reduced χ2 of 7.6.
Current usage metrics show cumulative count of Article Views (full-text article views including HTML views, PDF and ePub downloads, according to the available data) and Abstracts Views on Vision4Press platform.
Data correspond to usage on the plateform after 2015. The current usage metrics is available 48-96 hours after online publication and is updated daily on week days.
Initial download of the metrics may take a while.